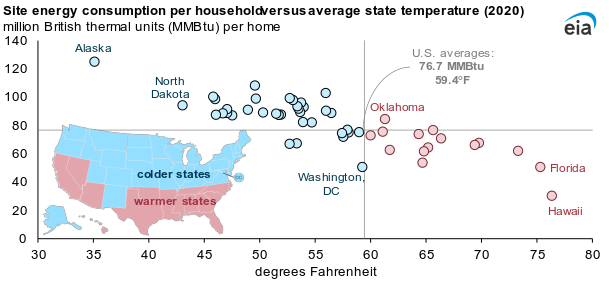
 The eia article U.S. households in warmer states consumer less site energy than household in colder states by Greg Lawson and Mickey Francis (5/4/2023) provides this great graph.
Site energy refers to the amount of energy that enters a home, including electricity from the grid, electricity from onsite solar panels, natural gas, propane, and fuel oil. Site energy includes different forms of energy, and with respect to electricity, it does not account for the losses associated with conversion of primary fuels to electricity or the electrical losses in the transmission and distribution system. Site energy consumption is a combination of the energy consumption from all energy end uses in a home, including seasonal end uses such as space heating and cooling, as well as non-seasonal end uses such as cooking and consumer electronics.
However,
In 2020, the average energy expenditures, or the amount of money a household spent on site energy, was affected by several factors beyond temperature, such as the type of energy used. Households in North Dakota (the second-coldest state) used an average of 94.3 MMBtu in 2020, nearly twice as much as homes in Florida (the second-warmest state), at 50.3 MMBtu. However, the average energy expenditures were about the same for homes in both states—$1,648 in North Dakota and $1,654 in Florida—in part because more than three-quarters of households in Florida reported that they only use electricity in their homes and U.S. average residential electricity prices are more than three times higher than residential natural gas prices.
There is one other nice graph of expenditures and links to data.