Extreme Weather

What is Climate Mapping for Resilience and Adaptation?

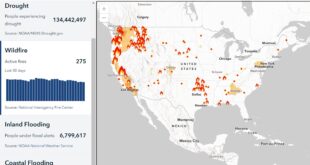
From CMRA: Climate Mapping for Resilience and Adaptation (CMRA) integrates information from across the federal government to help people consider their local exposure to climate-related hazards. People working in community organizations or for local, Tribal, state, or Federal governments can use the site to help them develop equitable climate resilience …

Read More »

Has Lake Mead Improved?

Lake Mead saw a slight uptick in August after hitting a new low again in July. The graph clearly shows that the wet season, if we can call it that, is roughly November through March. Unfortunately a good year doesn’t even get 20 feet dating back to 2012. Lake Mead …

Read More »

How much has Western US snowpack changed?

The Bloomberg article The End of Snow Threatens to Upend 76 Million American Lives by Baker et. el. (8/3/2022) has some excellent graphs, such as the one copied here, and overview of the water issues in the west. The West’s mountain snowpacks have shrunk, on average, 23% between 1955 and 2022. By …

Read More »

How much has Lake Mead Dropped?

Lake Mead water levels continue to drop. At the end of May it was down to 1047.69 feet, which is a 13.8 foot drop since my post on April 25 with the end of March height. The west continues in drought according to the Drought Monitor. What about electricity generation? …

Read More »

Are there more hurricanes due to climate change?

The climate.gov article Can we detect a change in Atlantic hurricanes today due to human-caused climate change? by Chris Landsea and Tom Knutson (5/11/2022) is a great example of the challenges in understanding complex systems. If all you want is the answer: Atlantic hurricanes display distinct busy and quiet periods:  Busy …

Read More »

What is the status of Lake Mead?

Most of the western half of the U.S. continues to have various levels of drought (see U.S. Drought Monitor) and Lake Mead has reached a new low. The graph here is from the data on the Lake Mead at Hoover Dam, End of Month Elevation (feet) page by the Bureau …

Read More »

How many billion dollar disasters in 2021?

The NOAA Billion-Dollar Weather and Climate Disasters page keeps track of these events. During 2021, there were 20 separate billion-dollar weather and climate disaster events across the United States. The total cost from these events of 2021 was $145.0 billion and is the third most costly year on record, behind 2017 and 2005. The total costs …

Read More »

How dry is Arizona?

From the climate.gov article Western Drought 2021 Spotlight: Arizona by Tom Di Liberto (7/29/2021): Looking back even farther by using a drought indicator known as the Standardized Precipitation Index, the current drought in Arizona is also the worst on record back to the late 1800s. Going back even farther than …

Read More »

How Low is Lake Mead?

The Bureau of Reclamation posts the end of month elevation for Lake Mead dating back to 1935. I created the graph of minimum yearly end of month elevation starting in 1940 since Hoover Dam was only created in 1935. Here is the R code to create the graph including importing …

Read More »