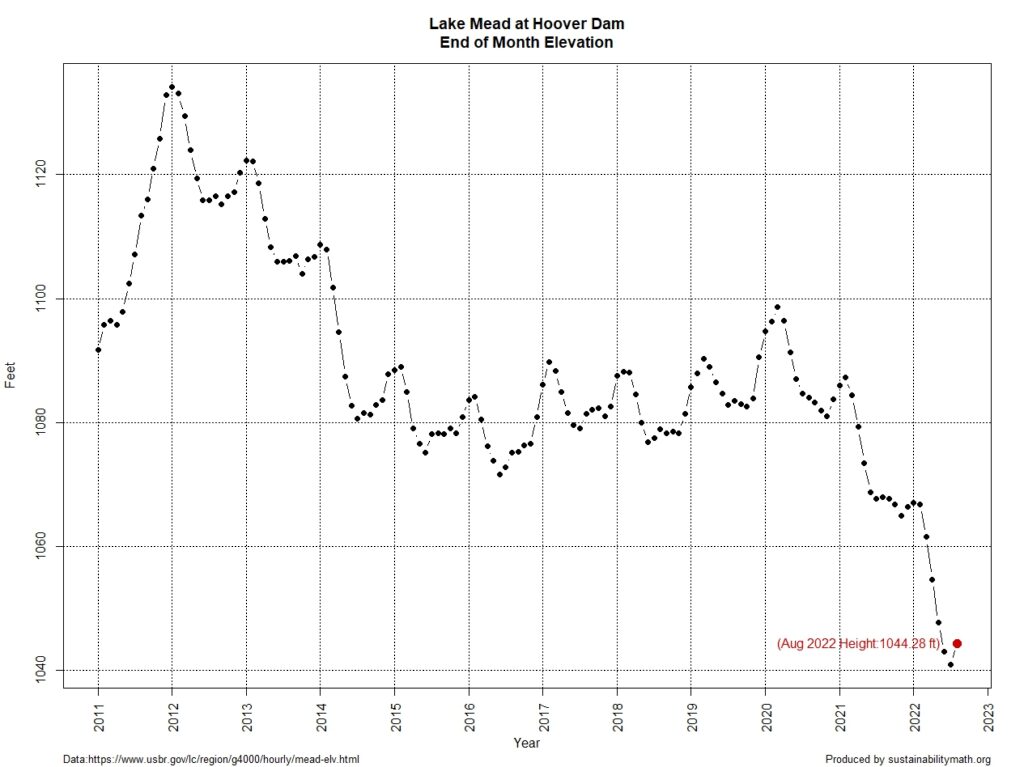
Lake Mead saw a slight uptick in August after hitting a new low again in July. The graph clearly shows that the wet season, if we can call it that, is roughly November through March. Unfortunately a good year doesn’t even get 20 feet dating back to 2012. Lake Mead needs a 2011 year. I’ll check back in a few months. Data is from the Lower Colorado River Operation. R code from the graph is linked on my July 2021 Lake Mead post.

