Tag Archives: Lake Mead

What is Lake Mead’s Elevation?

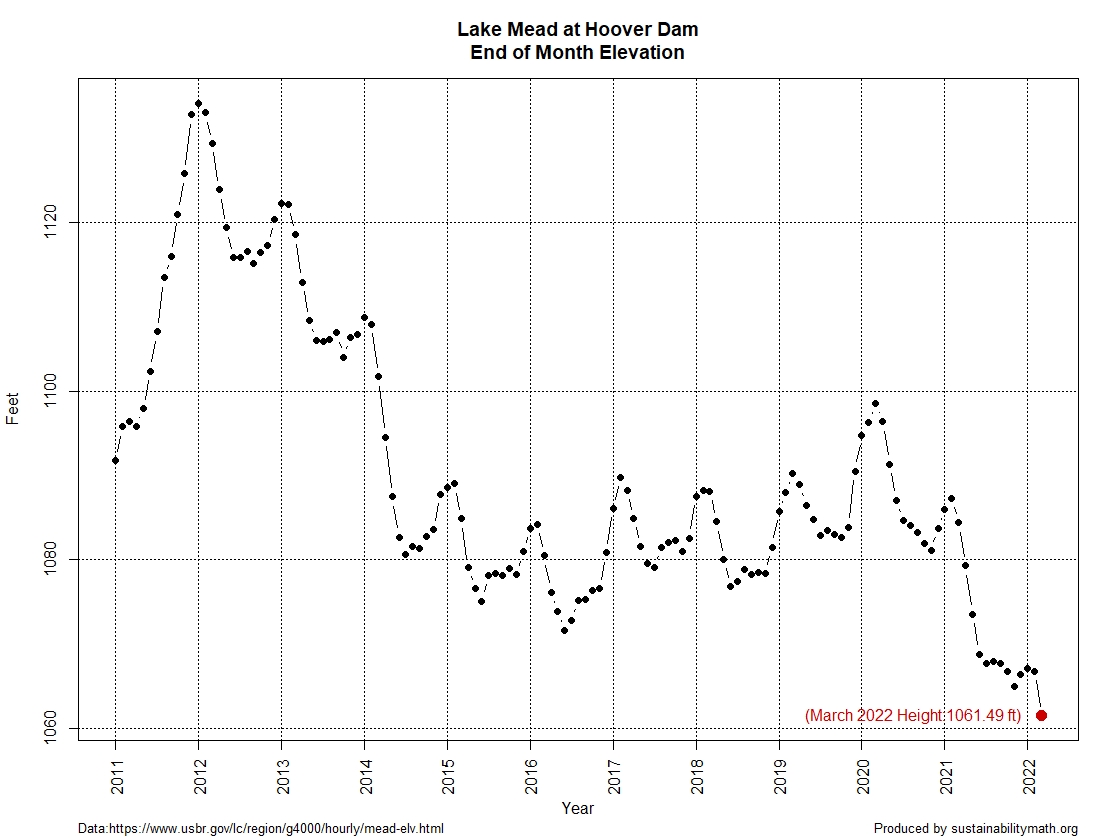
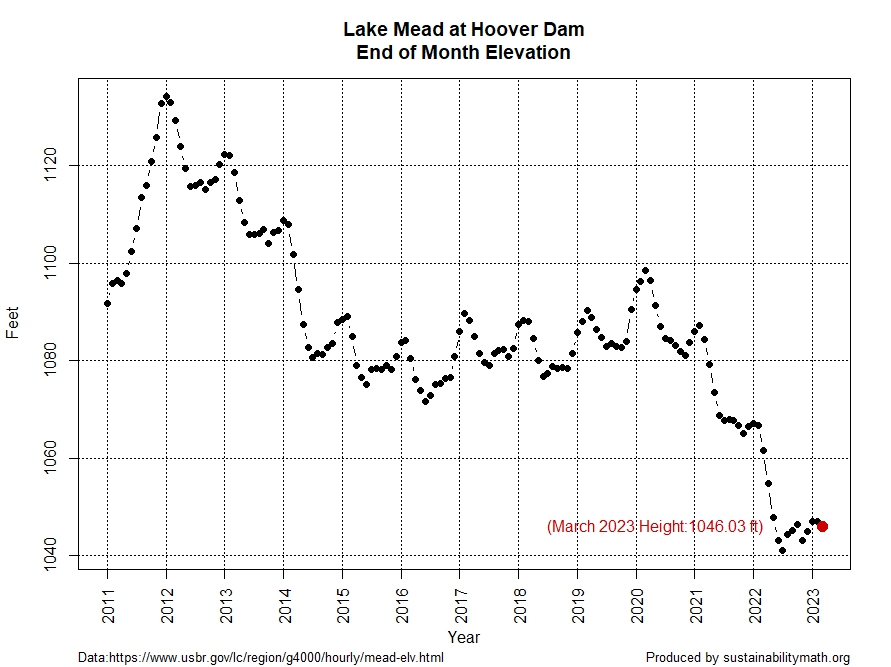
If you aren’t good with geography you might think all the rain in California should have Lake Meade rising. As you can see from the graph Lake Mead didn’t rise much this winter and it is heading back down again. At this point dropping below 1040 ft in the next few months is likely. The previous Lake Mead post with links to the data.  I’ll check back in a couple of months.

Has Lake Mead improved?

If you have been following my Lake Mead post you might be  curious if the rain in the west has improved the situation. Well, you probably looked at the graph by now and realized that the levels haven’t risen much. Based on the graph it seems that Dec to Jan is typically the biggest jump in levels with the max occurring each year between Jan and March. I’ll check back once the March data is in, but this certainly seems like a problem that is only getting worse.

The graph here is from the data on the Lake Mead at Hoover Dam, End of Month Elevation (feet) page by the Bureau of Reclamation. The Sept Lake Mead post.

Has Lake Mead Improved?

Lake Mead saw a slight uptick in August after hitting a new low again in July. The graph clearly shows that the wet season, if we can call it that, is roughly November through March. Unfortunately a good year doesn’t even get 20 feet dating back to 2012. Lake Mead needs a 2011 year. I’ll check back in a few months. Data is from the Lower Colorado River Operation.  R code from the graph is linked on my July 2021 Lake Mead post.


Data here.

What is the status of Lake Mead?

Most of the western half of the U.S. continues to have various levels of drought (see U.S. Drought Monitor) and Lake Mead has reached a new low. The graph here is from the data on the Lake Mead at Hoover Dam, End of Month Elevation (feet) page by the Bureau of Reclamation. How low can Lake Mead go before it gets serious?

The Sept Lake Mead post and the July Lake Mead post, which has a link to the R code for the graph.