About two months ago I had the post How low is Lake Mead? The graph in the post was the yearly minimum end of month elevation. In this post we have a closer look at the end of month elevation since 2011. The last month in the data is July 2021, which is a record low following the previous record low in June 2021. In the previous post I mentioned that this really should be given in some per capita format. I’ll add that presumably the decrease in the volume of water is not linear with the lake elevation. Data here.
Tags climate change data source water
Check Also
What is Climate Mapping for Resilience and Adaptation?
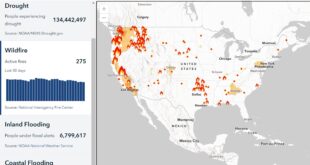
From CMRA: Climate Mapping for Resilience and Adaptation (CMRA) integrates information from across the federal …

