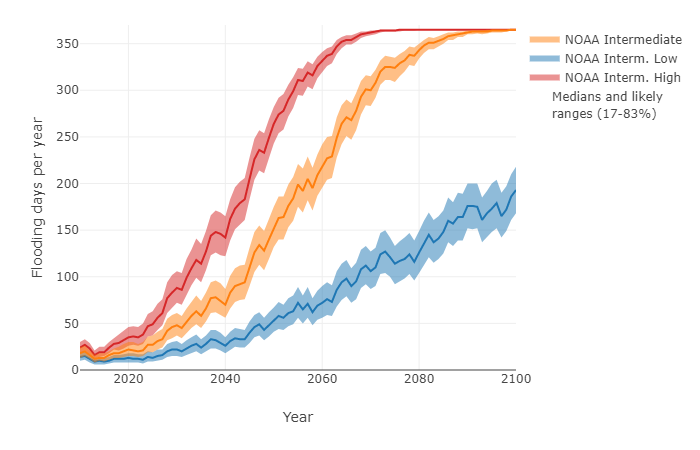
Sea level rise will increase the likelihood of tidal flooding. NASA has posted a tool, Flooding Days Projection Tool, to help understand how much tidal flooding may increase. There is a drop down menu for numerous locations in the U.S. For example, the graph here is for Kings Point, NY. Along with the value of the data there are calculus terms in the post:
These projections are based on unique, location-specific relationships between annual mean sea level, the top 1% of astronomical tides in each year, and annual counts of threshold exceedances.
An interesting and essential feature of these graphs is that the number of flooding days per year does not necessarily increase smoothly in time. In most cases, there are inflection points where the frequency of flooding days increases rapidly, which may be useful when establishing planning horizons. In many locations around the United States and its territories, there are sharp inflection points around the mid-2030s that are related to the interaction between accelerating sea level rise due to climate change and a long-term, 18.6-year cycle in the amplitude of astronomical tides.
And discussions of probabilistic modeling:
The purpose of this tool is to produce probablistic projections of flood frequency in the future that provide information about the full range of possibilities for a given year, including the potential for the occasional—yet inevitable—severe years. The projections leverage the predictability inherent in certain contributions (e.g., tidal amplitude and climate-change-induced sea level rise) and use statistical methods to account for everything else. The projections are probabilistic, because rather than producing a single, most-likely number of flooding days for a future year, these projections produce a range of plausible numbers with probabilities assigned to each possibility or range of possibilities.
All in all this is a great resources for math classrooms.