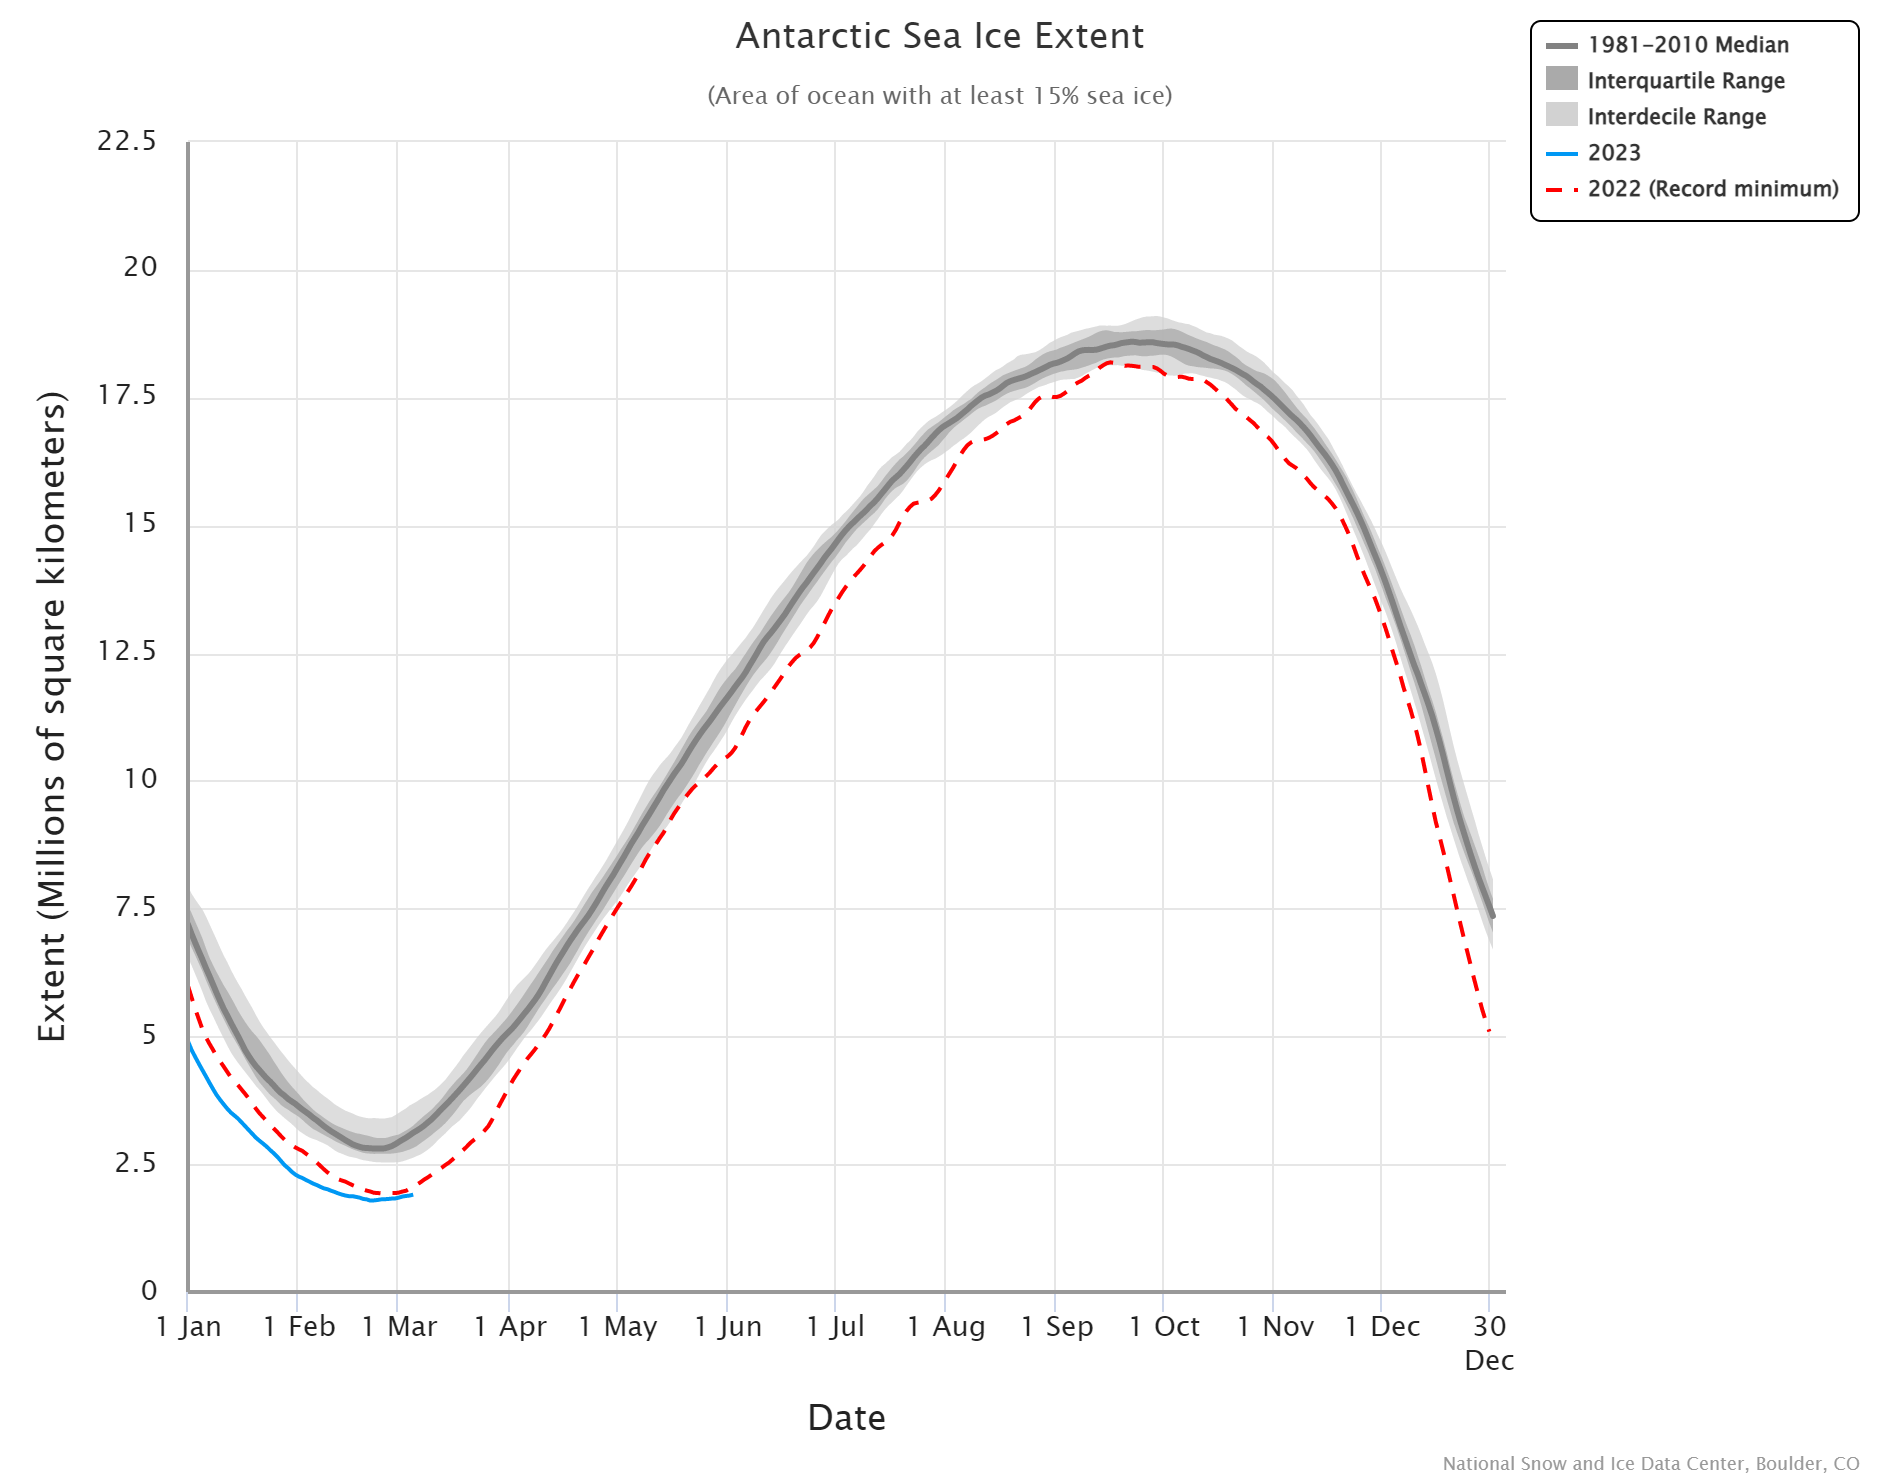
 The Antarctic set a new record sea ice minimum at 1.788 million square kilometers beating out last years 1.924 million square kilometers. The graph here comes from the National Snow and Ice Data Center’s (NSIDC) Charctic Interactive Sea Ice Graph. This is a great tool that allows the user to select Arctic or Antarctic, choose color schemes, and select the years to display. A link near the top right corner of the graph allows users to download the data and the graph.
When are simple-cycle natural gas turbines used?
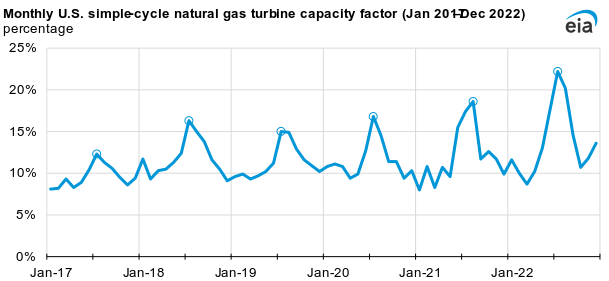
The eia article U.S. simple-cycle natural gas turbines operate at record highs in summer 2022 by Mark Morey (3/1/2023) reports:
The average monthly capacity factor for simple-cycle, natural gas turbine (SCGT) power plants in the United States has grown annually since 2020. Average capacity factors surpassed 20% for two consecutive summer months in 2022—the first time on record—to meet peak electricity demand, based on data from our Electric Power Monthly.
Why?
Electric grid operators can use SCGT power plants to respond quickly to fluctuating demand for electricity. The need for more electric grid support during the day is growing as the share of electricity generation from intermittent renewables grows. SCGT power plants can meet demand if there is a lull in wind or solar output. SCGT power plants can best provide grid support because they can produce electricity quickly to immediately fill gaps in electricity output on the grid, and they can ramp down just as quickly. Other natural gas-fired electricity generators, such as CCGT or steam boiler plants, can take two to three times longer than SCGT power plants to start and ramp up to full load.
The data is available from the article. Now, go and impress your friends with the fact that you know the difference between SCGT and CCGT.
How much time do teens spend with friends?
 The graph here come from the post The new CDC report shows that Covid added little to teen mental health trends by Jon Haidt (2/16/2023). His thoughts on this graph:
Here you can see a clear covid effect from 2019 to 2020, for all of the age groups who are 25 and older. You can see how the lines bend downward between 2019 and 2020. But look closely at the line for the youngest group, ages 15-24, in blue. This age group used to spend 2 hours a day hanging out with friends because these are teens and young adults. Most are students, few are married. So 2 hours a day with friends was the norm right up to the time when teens traded in their flip phones for smartphones, in the early 2010s. Once they did that, they moved their social lives onto a few large social media platforms, especially Instagram, Snapchat, and later Tiktok. They were spending vastly more time online, even when they were in the same room as their friends, which meant that they had far less time for each other (in face-to-face interaction or physical play).
I suggest that this is why the effect of covid restrictions on teen mental health was not very large: Gen Z’s in-person social lives were decimated by technology in the 2010s. They were already socially distanced when Covid arrived.
Those of us in education are aware of the challenges teens face with the blame largely put on Covid. Read Jon’s article as he makes a strong case that it isn’t Covid but trends that have been in play for a decade.
Has maternal mortality decreased?
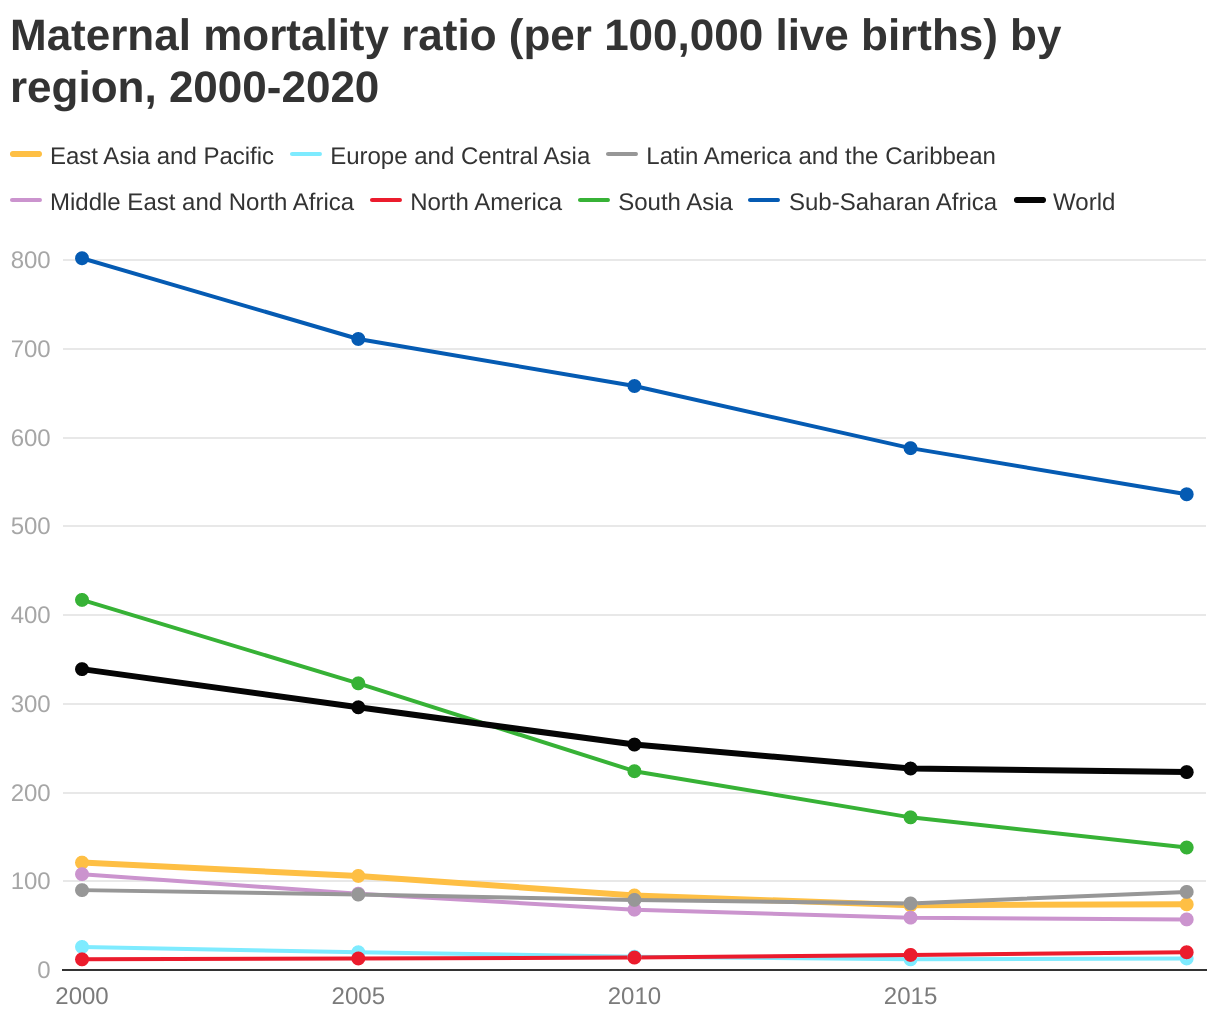
The World Bank article Progress in reducing maternal mortality has stagnated and we are not on track to achieve the SDG target: new UN report by Emi Suzuki, Charles Kouame, and Samuel Mills (2/22/2023) provides an update on maternal mortality. The key summary:
Globally, the MMR dropped by 34% between 2000 and 2020, and maternal deaths either increased or stagnated in most regions between 2016 and 2020.
There are some issues here as the graph in the article is interactive but information can only be found for the years shown and not 2016. So why go from 2016 to 2020 and not from 2015 to 2020? A definition of stagnated would be helpful too. Based on the regions in the graph one could also simply say the world overall decreased with only one region really increasing (Latin America and the Caribbean). The good news is that there has been some real progress in the last 20 years. On the other hand, overall progress has slowed. This shouldn’t be surprising as early intervention likely have a bigger impact.
The article has a pie chart of the number of the deaths by region which is questionable as one really should normalize by population, as they do in the graph copied here. This is a good article for discussion in a QL course.
How hot was January 2023?
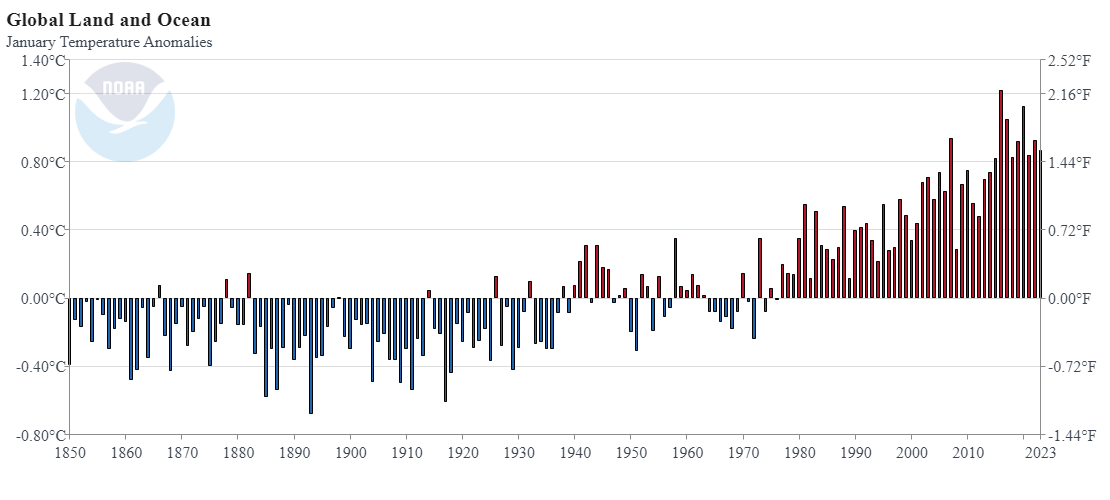 From NOAA’s January 2023 Global Climate Report:
January 2023 was the seventh-warmest January for the globe in NOAA’s 174-year record. The January global surface temperature was 1.57°F (0.87°C) above the 20th-century average of 53.6°F (12.0°C). January 2023 marked the 47th consecutive January and the 527th consecutive month with global temperatures, at least nominally, above the 20th-century average.
A few highlights:
This January, Europe had an unusually mild month that set a record for the warmest January on record. Europe’s surface temperature exceeded the previous January record set in 2007 by 0.16°C (0.28°F).
The Hawaiian region tied a 1941 record for its warmest January on record.
The contiguous U.S. had its sixth-warmest January on record. Seven states in the northeastern U.S.—New Hampshire, Vermont, Massachusetts, Rhode Island, Connecticut, New Jersey and Maine—had their warmest January on record.
Data is available at the top of the page.
What is the status of the Great Salt Lake?
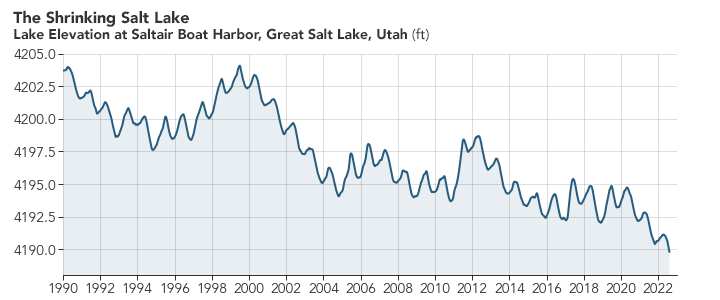
You may be seeing articles about the Great Salt Lake in the news and how it drying up is an environmental problem. NASA Earth Observatory had a great article last summer, The Great Shrinking Lake, with maps and data about the loss of water.
Though water levels in the Great Salt Lake can fluctuate by year, they have generally been declining for decades. At the lake’s highest recorded level in 1986, mean water elevation reached as high as 4,211.6 feet (1,283.7 meters). Since 1986, the lake has dropped about 22 feet, hitting a new record low on July 3, 2022. By August 10, 2022, water levels had dropped slightly more—to 4,189.6 feet (1,276.9 meters).
Now 20 feet may not seem like a lot, but click the NASA link and take a look at the then and now map with the slider. The surface area of the lake had decreased dramatically. The NASA post also has a well-done animated graph. If you want data about the Great Salt Like go to Hydroshare page Collection of Great Salt Lake Data. Daily updated lake elevation and drought maps can be found at the Great Salt Lake Water Level page.
Has Lake Mead improved?

If you have been following my Lake Mead post you might be curious if the rain in the west has improved the situation. Well, you probably looked at the graph by now and realized that the levels haven’t risen much. Based on the graph it seems that Dec to Jan is typically the biggest jump in levels with the max occurring each year between Jan and March. I’ll check back once the March data is in, but this certainly seems like a problem that is only getting worse.
The graph here is from the data on the Lake Mead at Hoover Dam, End of Month Elevation (feet) page by the Bureau of Reclamation. The Sept Lake Mead post.
How have commodity prices changes in the last month?
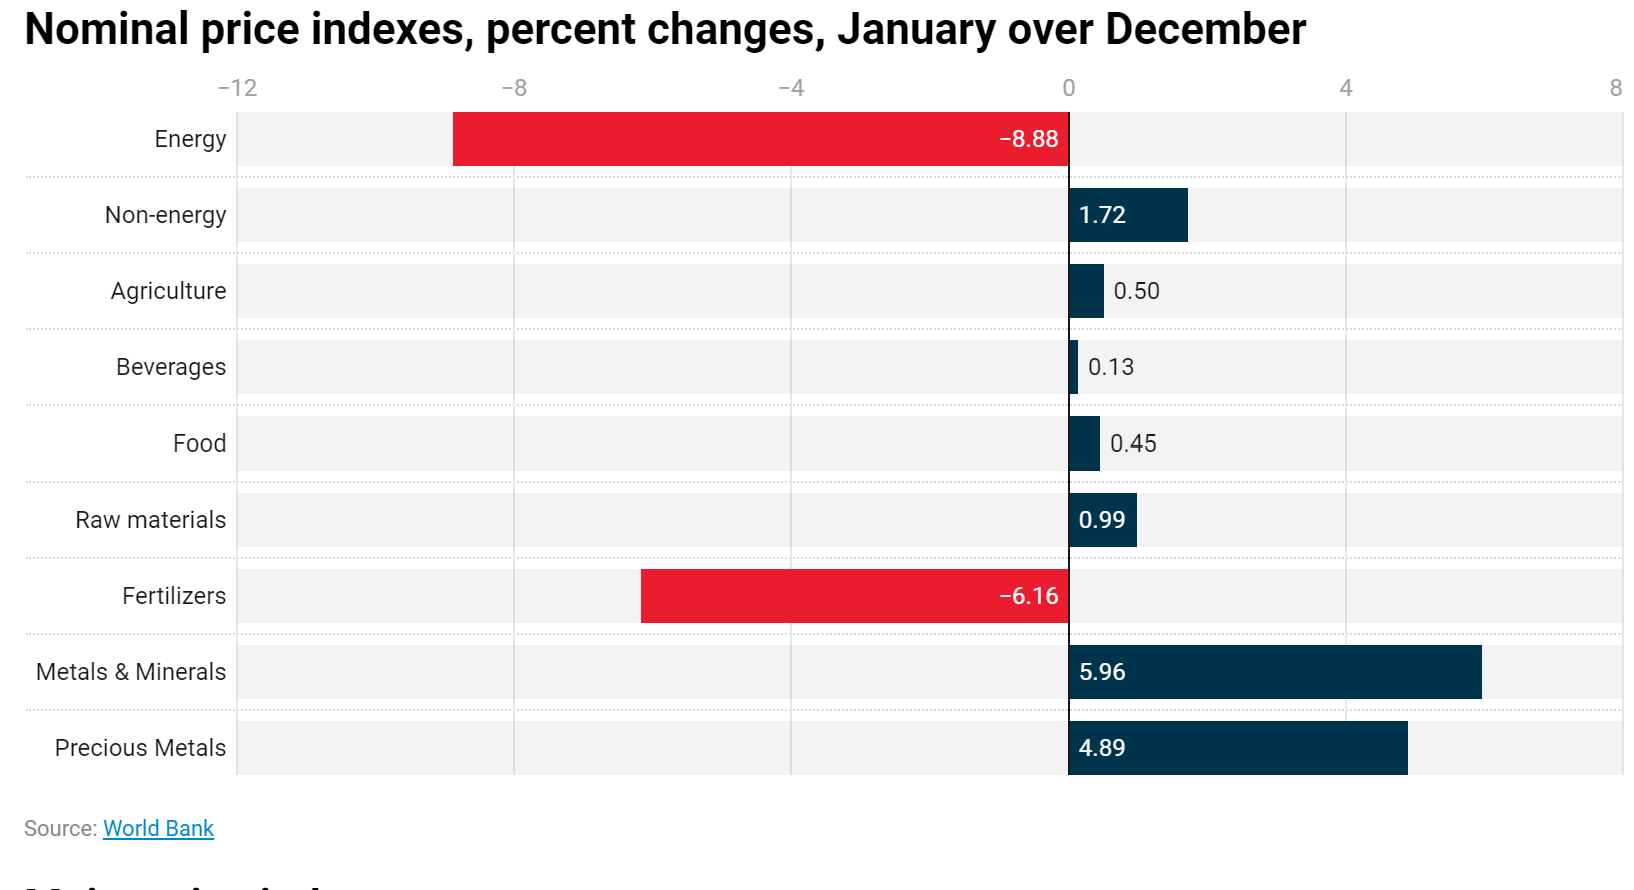
The World Bank has a monthly report that monitors commodity price movements, the pink sheet, highlighted in the post Energy prices dropped in January; non-energy inched up – Pink Sheet by John Bafffes and Maria Hazel Macadangdang (2/8/2023).
Energy prices dropped 8.9% in January, led by natural gas in Europe (-44%) and coal (-16.1%), the World Bank’s Pink sheet reported. Non-energy prices gained 1.7%, led by metals.
The pink sheet linked to in the article has plenty of data. Quiz question: Which commodity had the largest percent change? See the third graph for the answer.
By party, what are the biggest difference in top concerns?
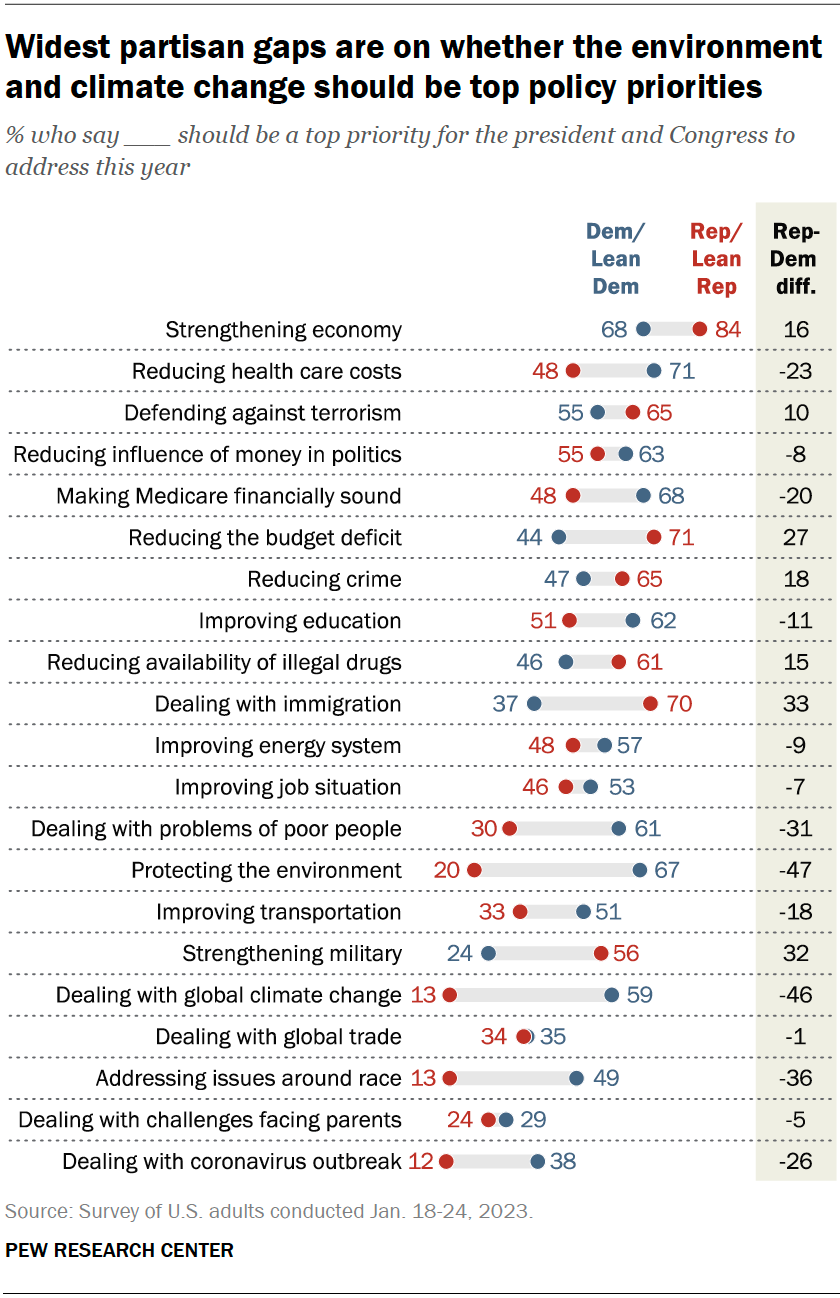
The pew article Economy Remains the Public’s Top Policy Priority; COVID-19 Concerns Decline Again (2/6/23) provides the graph here. The three biggest gaps:
The largest gaps between Republicans and Democrats are on protecting the environment and dealing with global climate change. Two-thirds of Democrats say environmental protection should be a top priority, compared with 20% of Republicans. Similarly, 59% of Democrats say this about climate change versus just 13% of Republicans.
Democrats also are much more likely than Republicans to prioritize addressing issues around race (49% top priority among Democrats vs. 13% among Republicans)
One might expect that the biggest gaps would come in categories where one group is very positive and the other not and it does for the top category of protecting the environment (67-20). Interesting though the third biggest gap on issues around race does not even get a majority on the top group (Dems at 49%). What about the smallest gap where the low group is still above 50%? Reducing the influence of money in politics (55-63).
There are other breakdowns in the article including by race and by age. Great quantitative literacy article. There is also a methodology
How have incarceration rates changed?
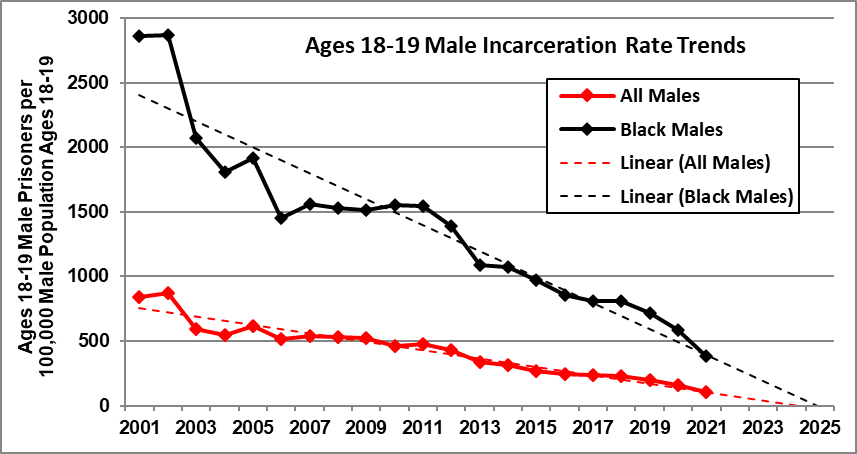
Rick Nevin has an excellent post, Update: Continuing trend toward zero youth incarceration (1/18/2023), that summarizes trends in incarceration rates. There are five interesting graphs, but the one here might surprise folks the most. There has been steady decrease in the gap between Black male incarceration rates and the overall male incarceration rates. Some quotes:
It is remarkable – and exasperating – that the debate over crime and incarceration almost entirely ignores divergent trends by age. Youth crime and incarceration are vanishing as arrest and incarceration rates are still increasing for adults over 50. The only crime theory that explains this divergence is the impact of birth year trends in preschool lead exposure.
The steeper decline in Black incarceration rates since 2001 reflects the fact that Black children recorded steeper blood lead declines associated with slum clearance over the 1960s and city air lead declines since the early-1970s (explained here).
I don’t think it is widely known that youth incarceration rates have been decreasing while over 50 have been increasing.
It is especially exasperating that criminal justice reform advocates ignore incarceration trends by age. Those trends should inform incarceration reduction strategies, to have the greatest impact and to generate the least resistance from “tough-on-crime” advocates.
We do not have a “mass incarceration” problem for youths. Not anymore. Reductions in preschool lead exposure have caused massive declines in youth crime and incarceration. We do still have mass incarceration for adults over 50, and it’s getting worse.
There are links to the data in the first sentence. Check out my lead crime project in the Statistics Projects section.