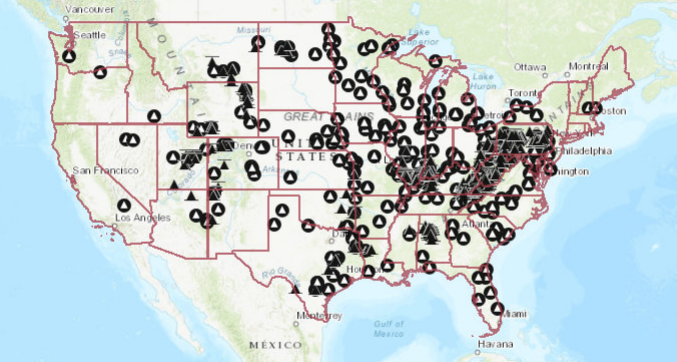
 The eia has an new U.S. Energy Mapping System. You can choose from numerous energy type. The map here was created by choosing coal mines and coal power plants (the black circles with the white triangles are coal power plants. You can zoom in and out of the map and add country or congressional district boundary lines.
How big will the Gulf of Mexico hypoxic zone be this year?
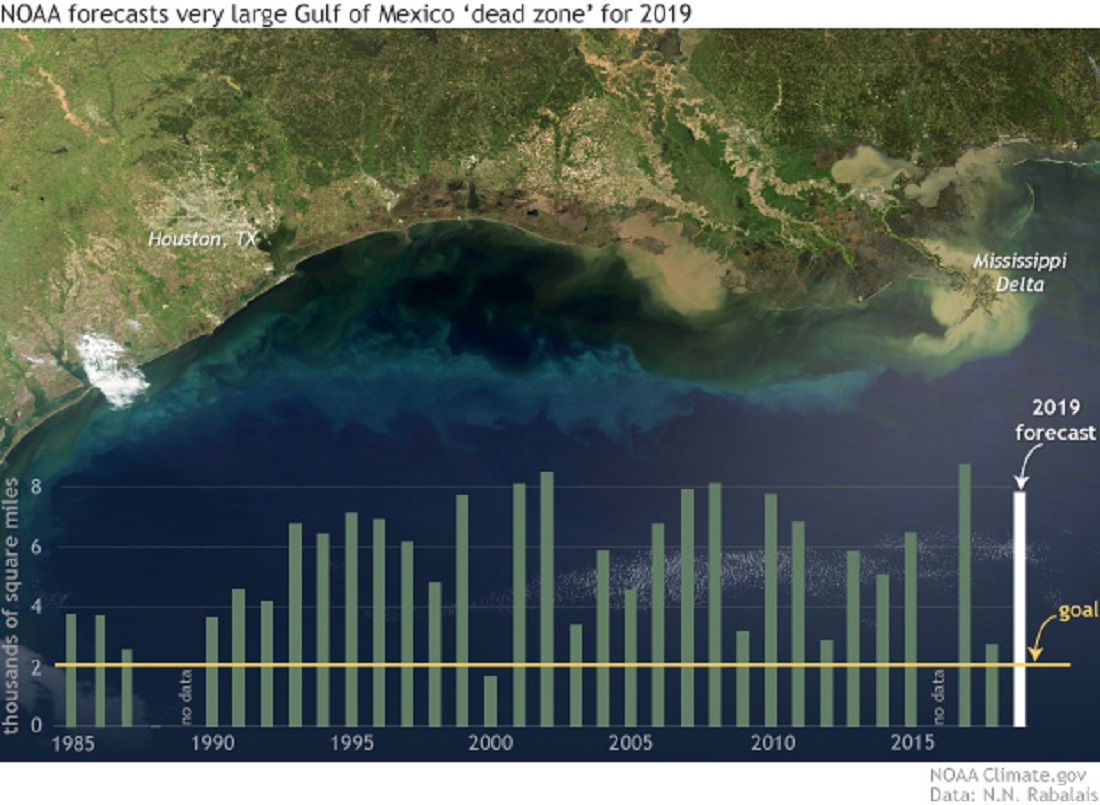
Climate.gov reports on the prediction by NOAA for the Gulf of Mexico hypoxic zone in the artcle Wet spring linked to forecast for big Gulf of Mexico ‘dead zone’ this summer by Rebecca Lindsey (6/18/19).
Last week, NOAA issued its annual forecast, saying that the summer dead zone—an area near the sea floor where there is little or no dissolved oxygen—may be just shy of 8,000 square miles in 2019, nearly as large as the record-setting area that occurred in 2017. The ecological impacts of the Gulf dead zone spread through the economy.
The hypoxic or ‘dead’ zone:
This spring surge in runoff feeds an overgrowth of algae and other plant-like microbes (phytoplankton) that live in the coastal waters. The algae eventually die and sink to deeper layers of the Gulf, where they are decomposed by bacteria. Like human breathing, decomposition uses up oxygen. Under the right conditions, the bottom waters become severely depleted in oxygen, suffocating fish and other marine life that can’t escape.
Is this normal?
Sediment cores dug up from the ocean floor indicate that a large, yearly dead zone is not a natural phenomenon in the Gulf of Mexico. Microfossils in the sediment layers from the years 1700-1900 include species that cannot tolerate hypoxic (low oxygen) waters, which is a good sign that oxygen stress wasn’t a widespread problem before the twentieth century.
The article has other interesting maps but doesn’t provide the data in the graph. The data might be acquired with an email to LUMCON. The original NOAA post, NOAA forecasts very large ‘dead zone’ for Gulf of Mexico (6/12/19) has links to their water monitoring stations.
How hot has it been this week?
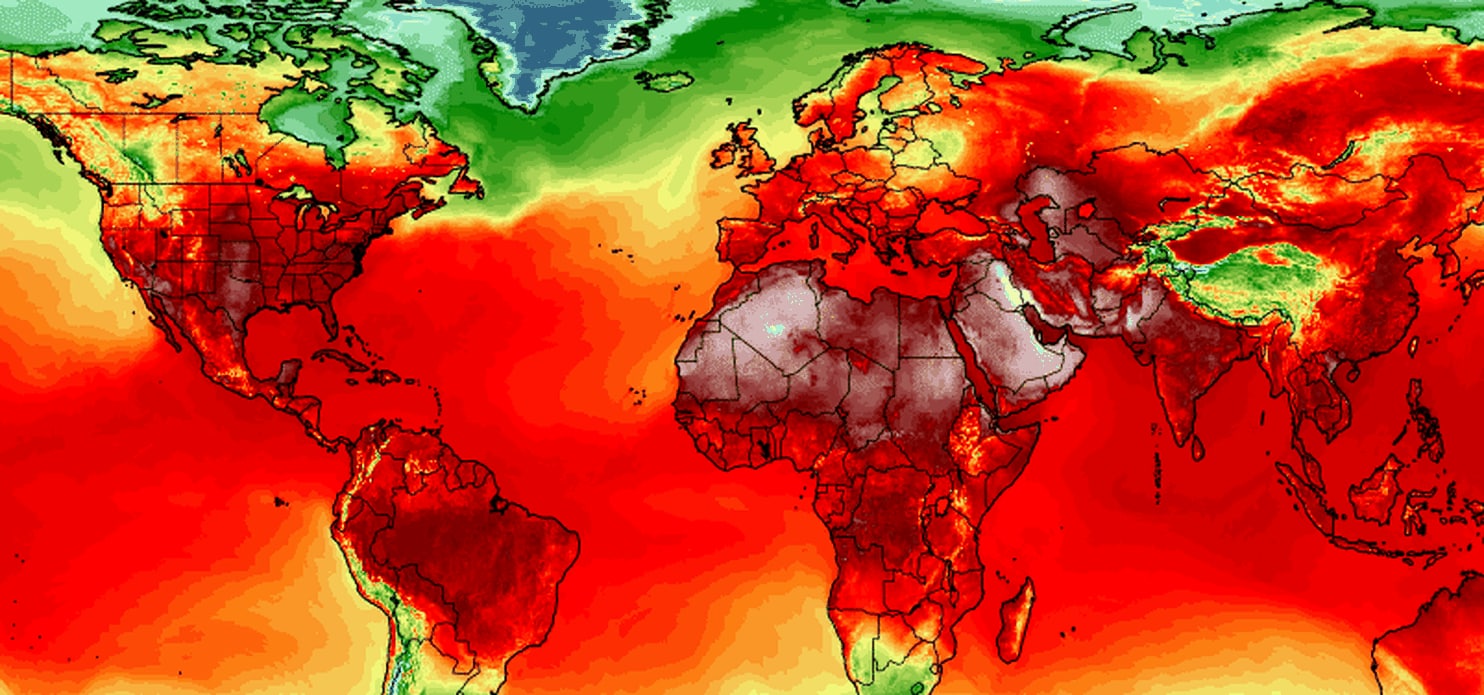
The Washington Post article, Red-hot planet: All-time heat records have been set all over the world during the past week by Jason Samenow (7/5/18), provides a nice overview of the record setting heat during this past week (map posted here copied from the article). In North America:
Montreal recorded its highest temperature in recorded history, dating back 147 years, of 97.9 degrees (36.6 Celsius) on July 2. The city also posted its most extreme midnight combination of heat and humidity.
Ottawa posted its most extreme combination of heat and humidity on July 1.
In Europe:
Excessive heat torched the British Isles late last week. The stifling heat caused roads and roofs to buckle, the Weather Channel reported, and resulted in multiple all-time record highs:
In the Middle East:
As we reported, Quriyat, Oman, posted the world’s hottest low temperature ever recorded on June 28: 109 degrees (42.6 Celsius).
Maps of temperature anomalies can be created for various time periods from NASA’s GISS Surface Temperature Analysis page. June isn’t available yet but it will be before long. Monthly Global Climate reports are available from NOAA. June isn’t available yet, but here are two highlight from May:
The contiguous U.S. May 2018 temperature was 2.89°C (5.2°F) above the 20th century average and the highest May temperature since national records began in 1895. This value exceeds the previous record set in 1934 by +0.4°C (+0.7°F).
Europe had its warmest May since continental records began in 1910 at +2.76°C (4.97°F), surpassing the previous record set in 2003 by +0.92°C (+1.66°F). May 2018 marks the first time in May that the continental temperature departure from average is 2.0°C (3.6°F) or higher.