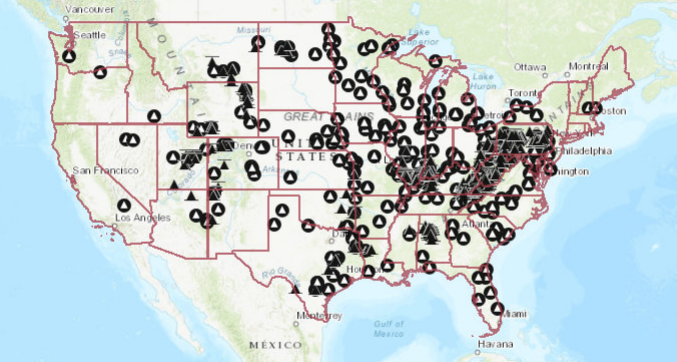
 The eia has an new U.S. Energy Mapping System. You can choose from numerous energy type. The map here was created by choosing coal mines and coal power plants (the black circles with the white triangles are coal power plants. You can zoom in and out of the map and add country or congressional district boundary lines.
Tags charts and graphs maps QL
About Thomas J. Pfaff
Check Also
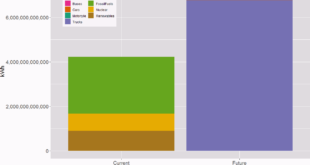
What will it take to run the U.S. on electricity?
That is the title of a recent post on Briefed by Data. The graph here, …