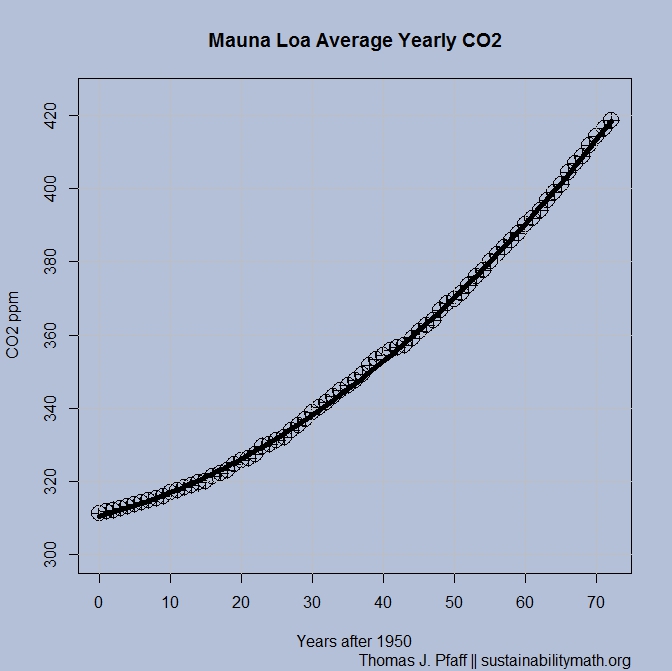
Mauna Loa Yearly Average CO2
- Data: Excel File or CSV File (3/2023)
- Project: Word
- R Script
- Skills: Polynomial Differentiation, Tangent Line Problem
- Note: The Word file contains the graph and the equation. If you would like students to do the curve fitting then delete the graph and give them the excel file.
- Learn more about CO2 as a greenhouse gas: EPA overview of greenhouse gasses
Global Average Temperature

- Data: Excel File or CSV File (3/2023)
- Project: Word
- R Script
- Skills: Function Composition, Polynomial Differentiation, Tangent Line Problem.
- Note: The Word file contains the graph and the equation. If you would like students to do the curve fitting then delete the graph and give them the excel file.
- Learn more about the impacts of climate change: IPCC 6th assessment report and the EPA Climate change page.
Global Marine Surface Methane

- Data: Excel File or CSV File (3/2023)
- Project: Word
- R Script
- Skills: Polynomial Differentiation, Tangent Line Problem.
- Learn More about methane: EPA Methane Emissions, NOAA Trends in Methane, and The NOAA Annual Greenhouse Gas Index (AGGI) (includes information on radiative forcing)
- Feedback loops related to methane: Methane Bubbles and Melting Permafrost
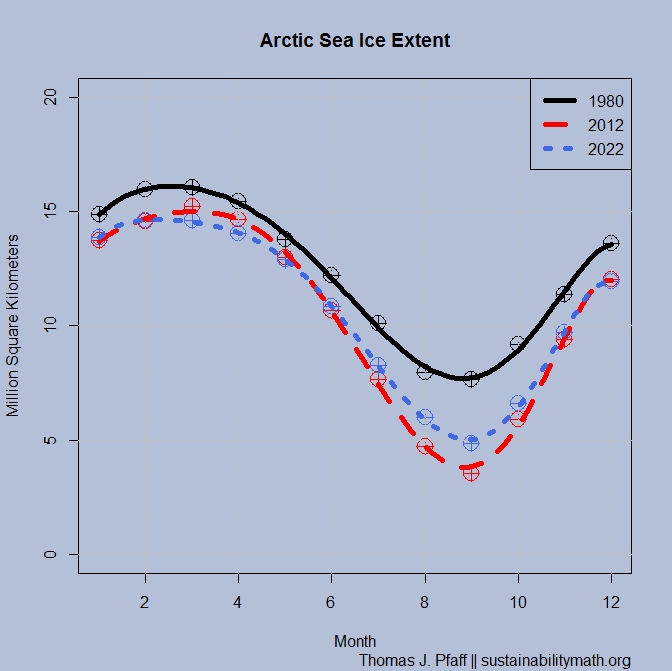
Arctic Sea Ice
- Data: Excel File or CSV File (3/2023)
- Project: Word
- R Script
- Skills: Sixth degree polynomial differentiation, max/min, finding roots.
- Notes: This is an excellent example of a meaningful inflection point. Students will need technology to solve for zero in this project.
- Learn More about Ice-Albedo Feedback: The NSIDC on why the cryosphere matters and Windows to the Universe.
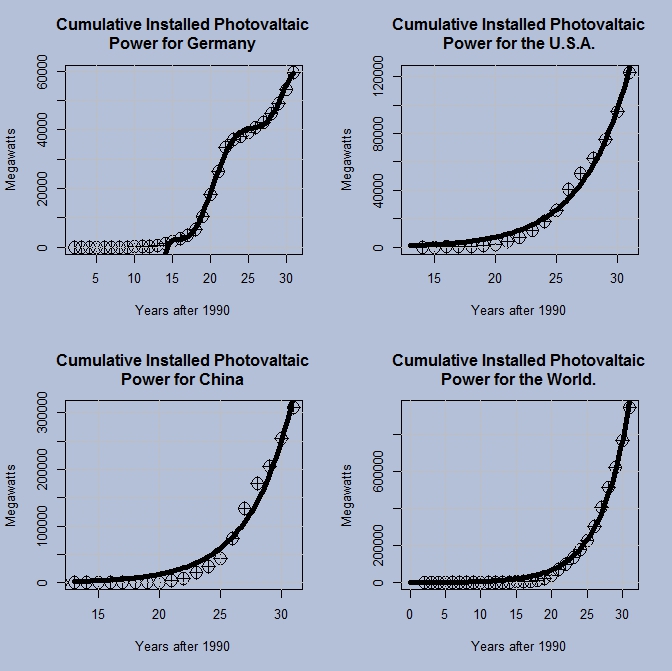
Country Photovoltaic Energy Production (and more)
- Data: Excel File or CSV File (2/2023)
- Note: The Excel file also includes historic production capacity and Solar Electricity Stats. There is more data in the spreadsheet than used here and there are likely multiple interesting uses of this data.
- Project: Word
- R Script
- The assignment includes three logistic curves (Germany, Italy, and U.S.) and two exponential curves (U.S. and World). The excel file includes more countries that can be used.
- Skills: Differentiating polynomial and exponential functions, quotient (or Product) rule.
- Learn more about solar power as part of electricity generation: Our World in Data Electricity Mix
Wind Energy by Selected Countries and World

- Data: Excel File or CSV File (3/2023) Note: As of March 2023 the last IEA-wind annual report was 2021. Hence no new data past 2020 yet.
- Note: The excel file includes total installed wind power for selected countries and the world (used in the assignment here) since 1980 and the percent of electricity generated by wind for selected countries since 2010.
- Project: Word
- R Script
- Skills: Polynomial and logistic Differentiation, Quotient (or Product) Rule.
- Learn more about wind power: Wind energy basics from the Department of Energy and the environmental impacts of wind power by the Union of Concerned Scientists (2015 article but still good).
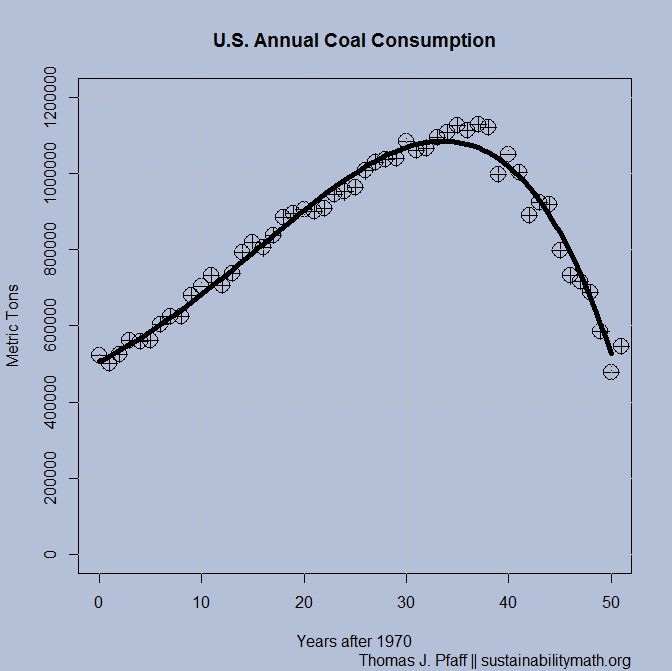
U.S. Coal Consumption and Production
- Data: Excel File or CSV File (3/2023)
- Project: Word
- R Script
- Skills: Fourth degree polynomial differentiation, max, finding roots.
- Notes: Students will need technology to solve for zero in this project. The excel file contains more data than is used here. The project uses production and consumption data but the file also contains coal imports and exports in terms of tons and BTU.
- Learn more about coal: NYT article Coal Production Plummets to Lowest Level in 35 Years (2016 article) and coal explained by the eia.
World Population

- Data: Excel File or CSV File (3/2023)
- Project: Word
- R Script
- Notes: The main goal of this project is to illustrate the differences of the growth of exponential and quadratic functions. Second to that is the comparisons to U.N. projects are off suggesting they are using a different model. The excel file contains decade population data (used for the project) and yearly population data for those interested.
- Skills: Polynomial and Exponential Differentiation, Tangent Line Problem.
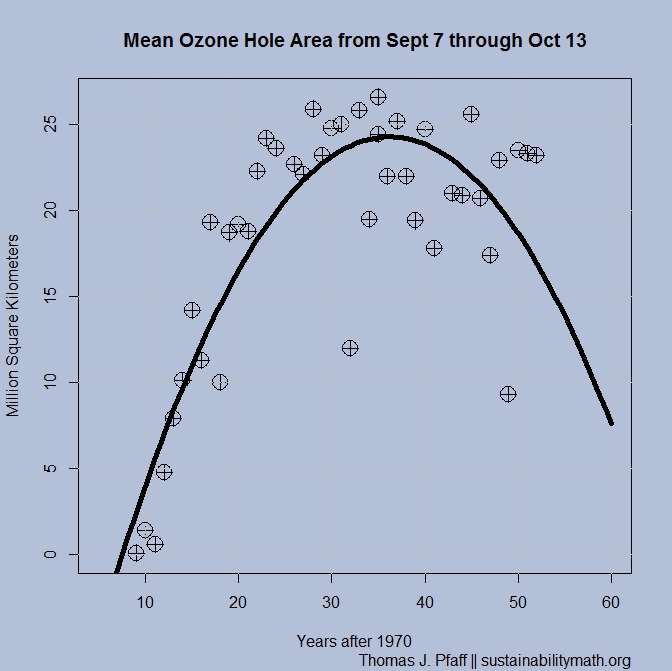
The Ozone Hole
- Data: Excel File or CSV File (3/2023)
- Project: Word
- R Script
- Skills: Polynomial Differentiation.
- Notes: One of the main points of the exercises here is to see the impact of regulations and how we can make changes so that unwanted extrapolations don't happen. This exercise also shows how extrapolations can be far off especially when something changes. The excel file contains more data than used in the assignment.
- Learn more about the ozone hole: NASA ozone hole watch and NOAA assessment of ozone depletion.
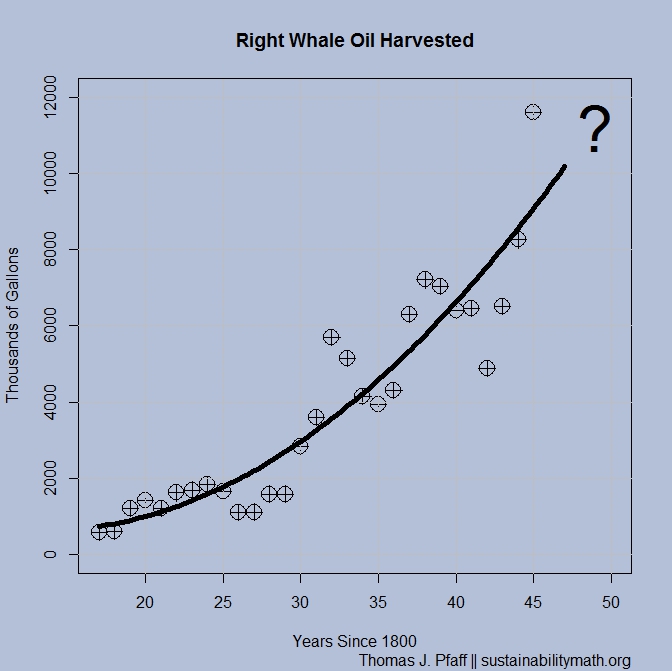
Historical Whale Oil Harvested and Prices
- Data: Excel File or CSV File (Historic Data from Ugo Bardi - No Updates Needed)
- Project: Word
- R Script
- Follow up project: Word This uses the same data as in the first assignment and has students curve fit using a TI-84 calculator (directions included), although consider using R or Excel instead.
- Notes: The file provided is used as an introduction to curve fitting and, in particular, it demonstrates issues with extrapolation. This is also an opportunity to talk about finite resources and peaking. The Excel file contains more data than is used in the assignment. There are notes in the Word file for instructors.
- Learn more about the history of whale oil and non renewable energy explained from the EIA.
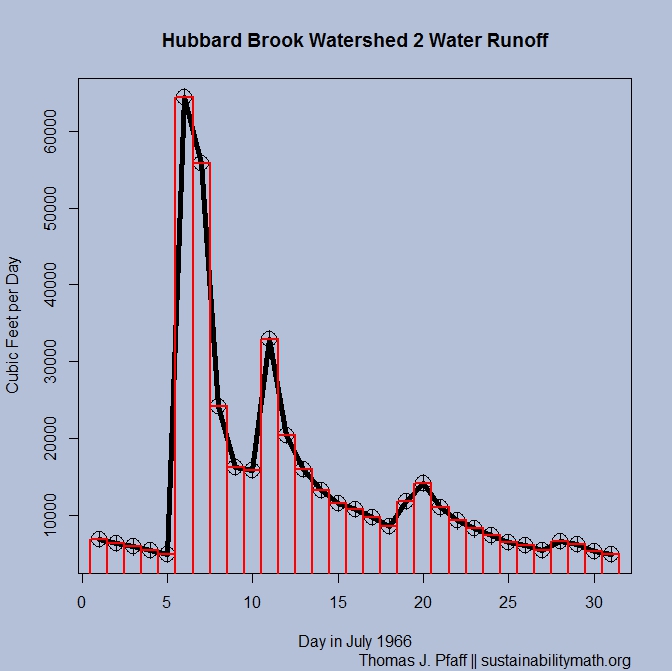
Ecosystem Service - Rain Runoff
- Data: Excel File or CSV File (Historic Data from the Hubbard Brook Ecosystem Study - No Updates Needed)
- Project: Word
- R Script
- Skills: Riemann Sums.
- Sustainability Goal: Understand the ecosystem service provided by trees and shrubs in absorbing water runoff.
- Learn more about ecosystem service from the Food and Agricultural Organization (FAO) of the United Nations Ecosystem Services & Biodiversity (ESB) pages.
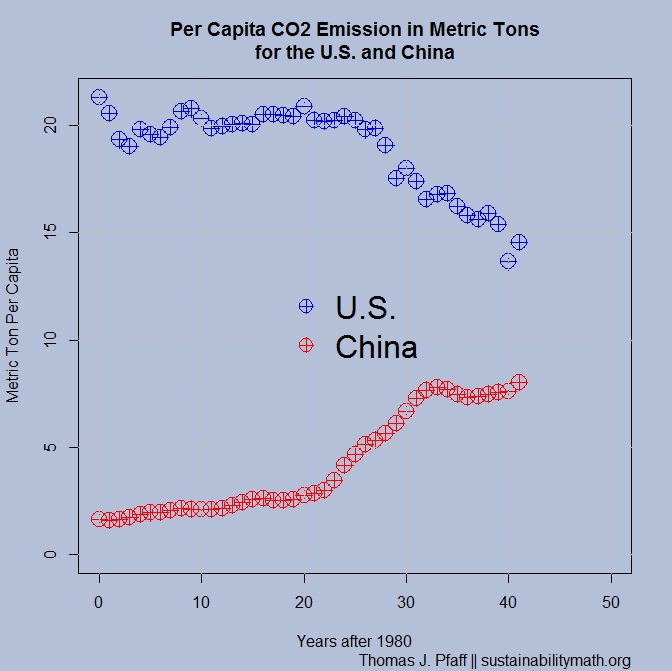
U.S. and China CO2 Emissions
- Data: Excel File or CSV File (3/2023)
- Project: Word
- R Script
- Skills: Riemann sums.
- Notes: The use of Riemann sums is basic, but the overall assignment is rich in context and demonstrates the value of area under a curve. The excel file includes total emissions, population, and per capita emissions.
- Learn more about U.S. and China CO2 emissions: Fact Check: What's China's role in climate change? (2021) and Carbon Footprint by Country (2023)
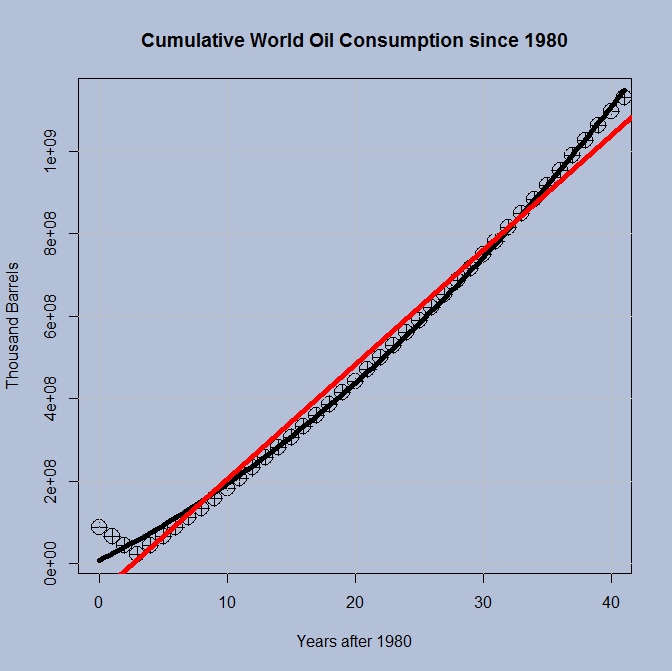
World Petroleum Consumption
 Data: Excel File or CSV File (3/2023)
- Project: Word
- R Script
- Skills: Setting up and solving and equation with an integral and one with just a function.
- Notes: Setting up the equations here may not be easy for students. This project also demonstrates the relationship between a function and its integral. The excel file also contains production along with consumption data.
- Learn more about oil reserves and peak oil: Lengthy but good 2014 paper The future of oil supply by Miller and Sorrell with numerous graphs.
Gini Coefficient Transition to Integration
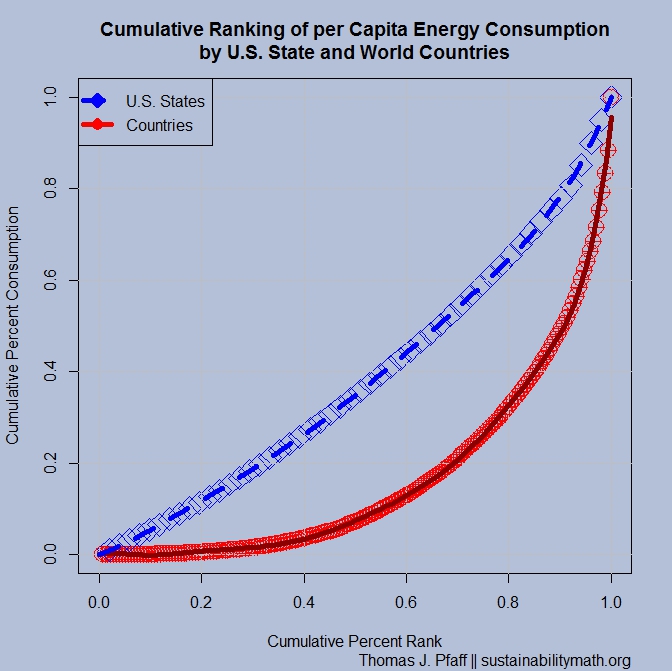
- Data: Excel File or CSV File (This data doesn't require updates,)
- Project: Word
- R script
- Notes: Overall, this assignment moves from differentiation ideas with an application of the mean value theorem to integration. Once students can integrate, you can return to this project and have students find the Gini coefficients. Note that you will need some form of technology to solve higher order polynomial for zero. This project is a really nice way to motive the need for the area under the curve before starting an integration unit.
- Skills: Mean Value Theorem, polynomial differentiation, and finding the roots of a higher order polynomial.
- Sustainability Goal: Learn one way inequality is measured.
- Learn more about the Gini Coefficient: Online paper at Numeracy: Measuring Resource Inequality: The Gini Coefficient
- Extra Materials: John Stewart talks about the Gini Coefficent This is a 2011 video and shows the ranking of U.S. income inequality by the gini coef as reported by the CIA.