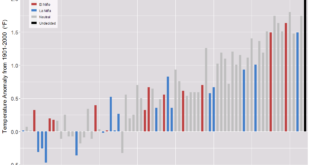
 Are you interested in historical temperature trends for your state? NOAA’s State Annual and Seasonal Time Series page has it for you. You can create graphs of annual average min and max temperatures as well as the annual mean temperature, for almost all states (Alaska and Hawaii aren’t listed) . This can be done for annual data or for each of the four seasons. The graphs are from 1805 to 2015. The graph hear is the annual mean temperature for New York State.
These charts present three color-coded time series. The gray line represents the annual (or seasonal) temperature value. The blue line shows the overall trend in a fashion that smoothes out the year-to-year variability in temperature. The light blue shaded area represents the 95% confidence interval for the trend. The smoothed temperature is constructed using a locally estimated scatterplot methodology known as LOESS.
There does not appear to be easy access to the data, but if you contact them (Contact link on the top bar) they may send it to you. Either way, the graphs include confident intervals, useful in stats, and can be used in QL courses. There is also an interactive U.S. temperature map.
