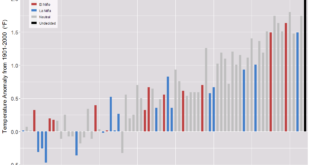
![]() You go to NOAA’s Event Tracker. The initial page is captured in the image here. Each dot represents an event. Scroll over the dot to get a title and summary, which you can then click on to go to the main story. On the bottom right you can select a month since December 2010 to see the events from just that month.
You go to NOAA’s Event Tracker. The initial page is captured in the image here. Each dot represents an event. Scroll over the dot to get a title and summary, which you can then click on to go to the main story. On the bottom right you can select a month since December 2010 to see the events from just that month.
Tags climate change climate events education resource
