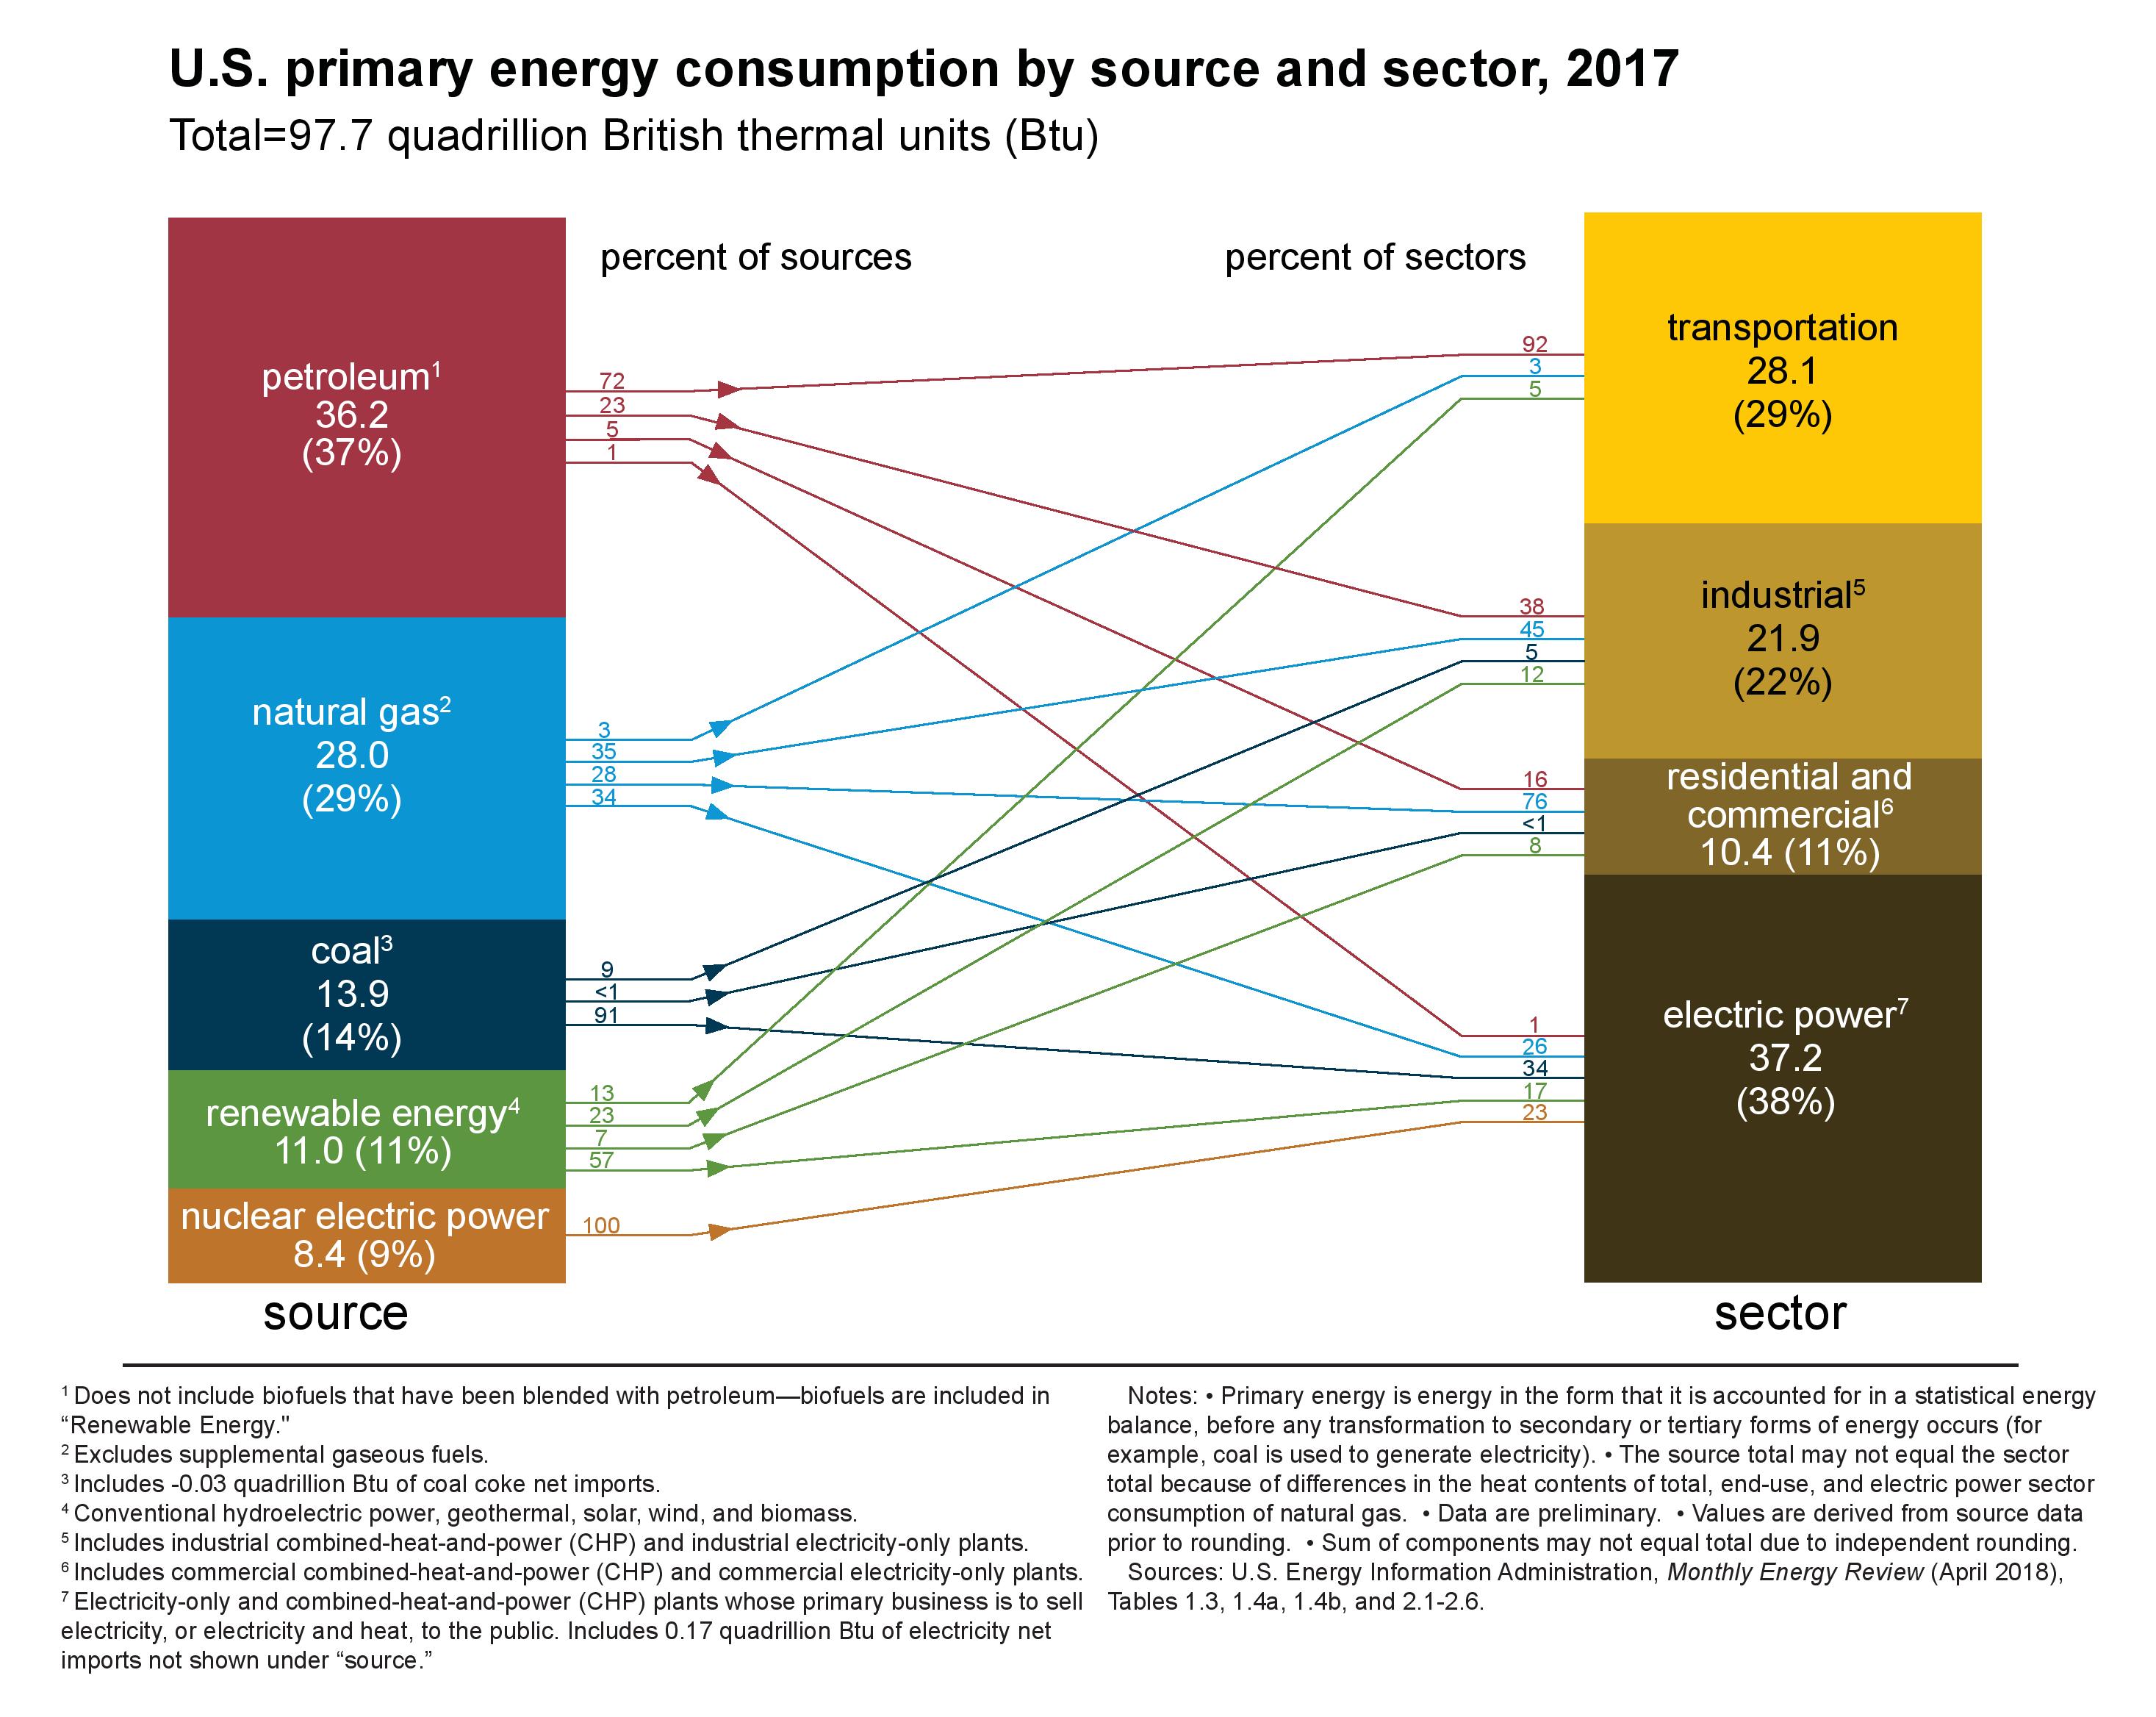
 Every year the EIA (U.S. Energy Information Agency) updates their energy flow and consumption diagrams. They are now available for 2017 energy use and the graph here is primary energy consumption by source and sector. For example, petroleum fulfills 37% or our energy use, 72% of petroleum is for transportation, and petroleum represents 92% of our transportation energy uses. Fossil fuels (petroleum, natural gas, and coal) generated 78.1 quadrillion BTUs, which is 80% of our energy production, in 2017. Links to this graph and the energy flow diagrams (total, petroleum, natural gas, coal, & electricity) are found at the bottom of the right side bar on the EIA Monthly Energy Review.
Past diagrams, dating back to 1996, are available at the Energy Flow Archives. In 2016 fossil fuels generated 78.5 quadrillion BTUs, which was 81% of our energy production. In 2008 (the first year this diagram appears) it was 83.4 quadrillion BTUs and 84%.