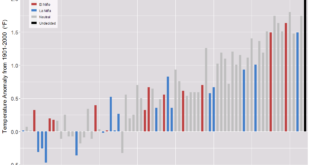
 According to the Climate Central post, Fall Warming Trends Across the U.S. (9/5/18), the average fall temperature for the U.S. has risen nearly 3°F since 1970 (see their graph copied here). Why does this matter:
Insects linger longer into the fall when the first freeze of the season comes later in the year. A new study from the Universities of Washington and Colorado indicates that for every degree (Celsius) of warming, global yields of corn, rice, and wheat would decline 10 to 25 percent from the increase in insects. Those losses are expected to be worst in North America and Europe.
The article has a drop down menu to select cities across the U.S. to see a graph similar to the one copied here for the selected city. They don’t post the data that was used to create the graphs but they do explain their data sources under methodology.
A statistics project could have students create this graph for their hometown. One way to obtain the data was noted in our post, What do we know about nighttime minimum temperatures?: Go to NOAA’s Local Climatological Data Map. Click on the wrench under Layers. Use the rectangle tool to select your local weather station. Check off the station and Add to Cart. Follow the direction from their being sure to select csv file. You will get an email link for the data within a day. Note: You are limited in the size of the data to ten year periods. You will need to do this more than once to get the full data set available for your station.
