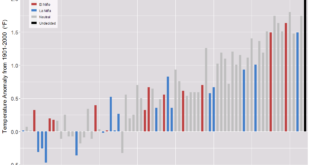
 According to the Climate Central post, Fall Nights Are Warming in Our Changing Climate (10/17/18), of 244 cities in the U.S., 83 percent have average fall low temperatures on the rise. For example, the graph here is for NYC. Why does this matter:
Warming fall nights mean more than just a delay in pulling out those comfortable sweaters and drinking hot apple cider. The lack of cool nights effectively lengthens the summer, as the first frost of the year also comes later. While warm-weather fans may celebrate, this also means that disease-carrying pests like mosquitoes and ticks will persist longer before dying off in the winter. Nationally, the long-term warming trend has lengthened the growing season by two weeks compared to the beginning of the 20th century. The allergy season is also getting longer, with ragweed pollens not disappearing until the first freeze of the fall.
The article has a drop down menu to select cities across the U.S. to see a graph similar to the one copied here for the selected city. They don’t post the data that was used to create the graphs, but they do explain their data sources under methodology.
A statistics project could have students create this graph for their hometown. One way to obtain the data was noted in our post, What do we know about nighttime minimum temperatures?: Go to NOAA’s Local Climatological Data Map. Click on the wrench under Layers. Use the rectangle tool to select your local weather station. Check off the station and Add to Cart. Follow the direction from their being sure to select csv file. You will get an email link for the data within a day. Note: You are limited in the size of the data to ten year periods. You will need to do this more than once to get the full data set available for your station.
