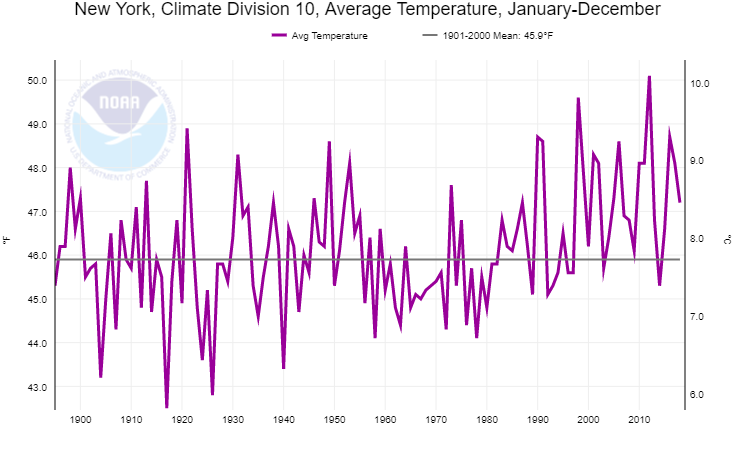
 Go to the NOAA Climate at a Glance Divisional Mapping page. From the first drop down menu choose a state. Below that a state map appears and now click on a region. If time series data is desired click on the second tab along the top that says time series. At this point the first drop down menu is to choose a parameter. There are seven choices including average, max, and min temperature as well as precipitation. A time scale can be chosen such as a single month or annual. For example, the graph here created from the site is average annual temperature for the finger lakes region in NYS. Along with a graph, a spreadsheet of the data can be downloaded.
Tags climate change data source