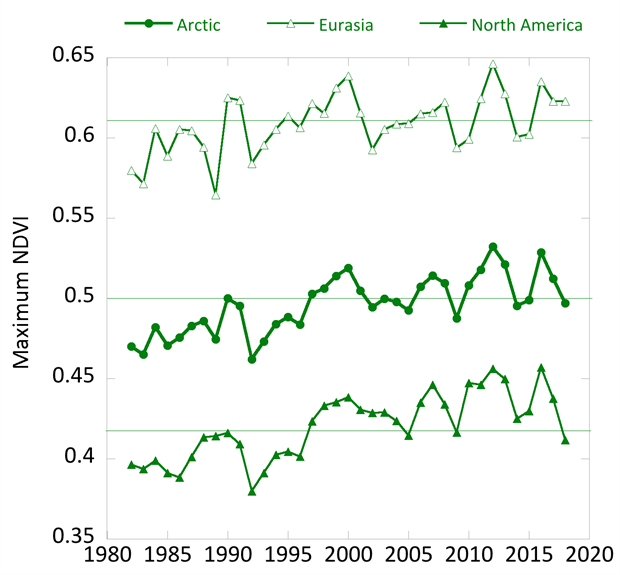
One section of NOAA’s Arctic Report Card: Update for 2019 is on Tundra Greenness. The graph here from their report is for maximum NDVI:
Normalized Difference Vegetation Index (NDVI), which is sensitive to the unique properties of photosynthetically-active vegetation in the Red and Near Infrared wavelengths. NDVI is highly correlated with the quantity of aboveground vegetation, or “greenness,” of Arctic tundra (Raynolds et al. 2012).
The graph here shows an upward trend, but it’s complicated:
Arctic lands and seas have experienced dramatic environmental and climatic changes in recent decades. These changes have been reflected in progressive increases in the aboveground quantity of live vegetation across most of the Arctic tundra biome—the treeless environment encircling most of the Arctic Ocean. This trend of increasing biomass is often referred to as “the greening of the Arctic.” Trends in tundra productivity, however, have not been uniform in direction or magnitude across the circumpolar region and there has been substantial variability from year to year (Bhatt et al. 2013, 2017; Park et al. 2016; National Academies of Sciences, Engineering, and Medicine 2019). Sources of spatial and temporal variability in tundra greenness arise from complex interactions among the vegetation, atmosphere, sea-ice, seasonal snow cover, ground (soils, permafrost, and topography), disturbance processes, and herbivores of the Arctic system.
The report has two maps and another graph.
