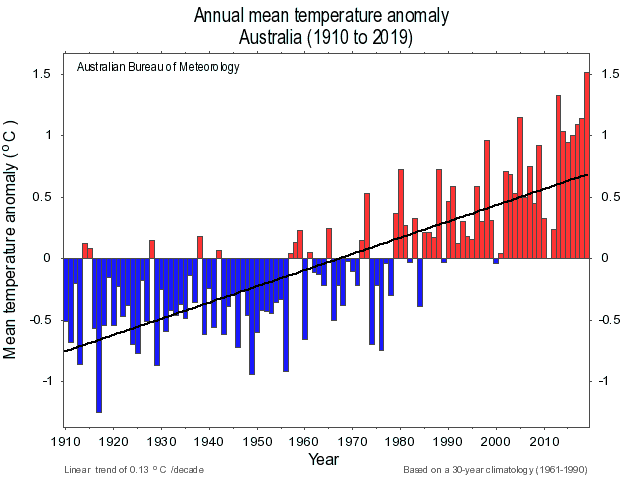
The graph here is from the Australian Bureau of Meteorology Climate changes – trends and extremes page. In 2019, the temperature was 1.52 deg C (2.7 deg F) above the 30 year average from 1961-1990, which is a new record. The second highest year is 2013 at 1.33 deg C above the average. The data is available on the page (there is a link in the box above the graph) and other attributes can be plotted. For instance, the maximum temperature for 2019 was 2.09 deg C (3.76 deg F) above the 30 year average, which is a new record with the second highest in 2013 at 1.59 deg C above the average.

