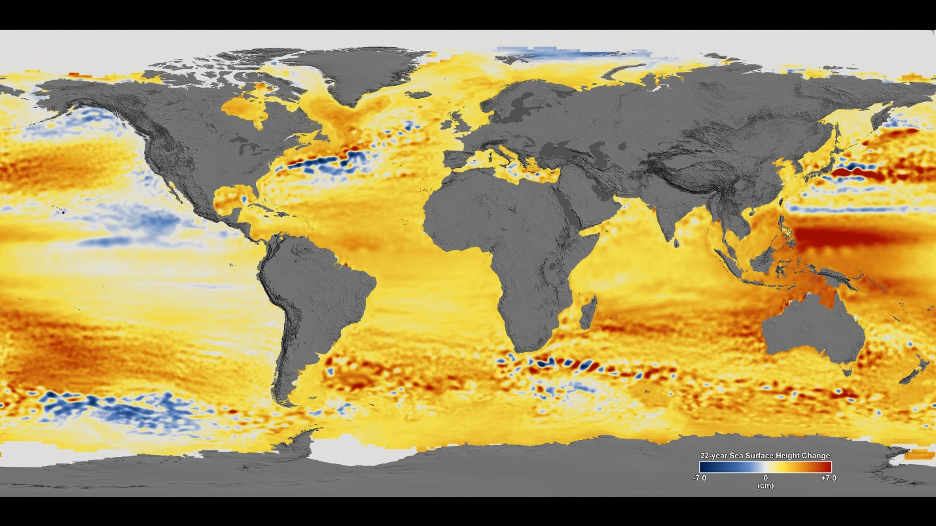
NASA’s Vital Signs of the Planet Sea Level Sea Level page provides data on sea level. For example, since 1993 sea level has increased by about 94mm, but this is an average. In their Sea Level 101, Part Two: All Sea Level is `Local’ by Alan Buis (7/14/2020) they provide the map copied here. There is noticeable variation in sea level change around the globe. They note:
“Relative sea level” refers to the height of the ocean relative to land along a coastline. Common causes of relative sea level change include:
-
-
Changes due to heating of the ocean, and changes in ocean circulation
-
-
-
Changes in the volume of water in the ocean due to the melting of land ice in glaciers, ice caps, and ice sheets, as well as changes in the global water cycle
-
Vertical land motion (up or down movements of the land itself at a coastline, such as sinking caused by the compaction of sediments, or the rise and fall of land masses driven by the movement of continental or oceanic tectonic plates)
-
Normal, short-term, frequent variations in sea level that have always existed, such as those associated with tides, storm surges, and ocean waves (swell and wind waves). These variations can be on the order of meters or more (discussed in more detail in our previous blog post).
-
There are other graphics in the post including an animation of Greenland ice loss with a scatter plot.