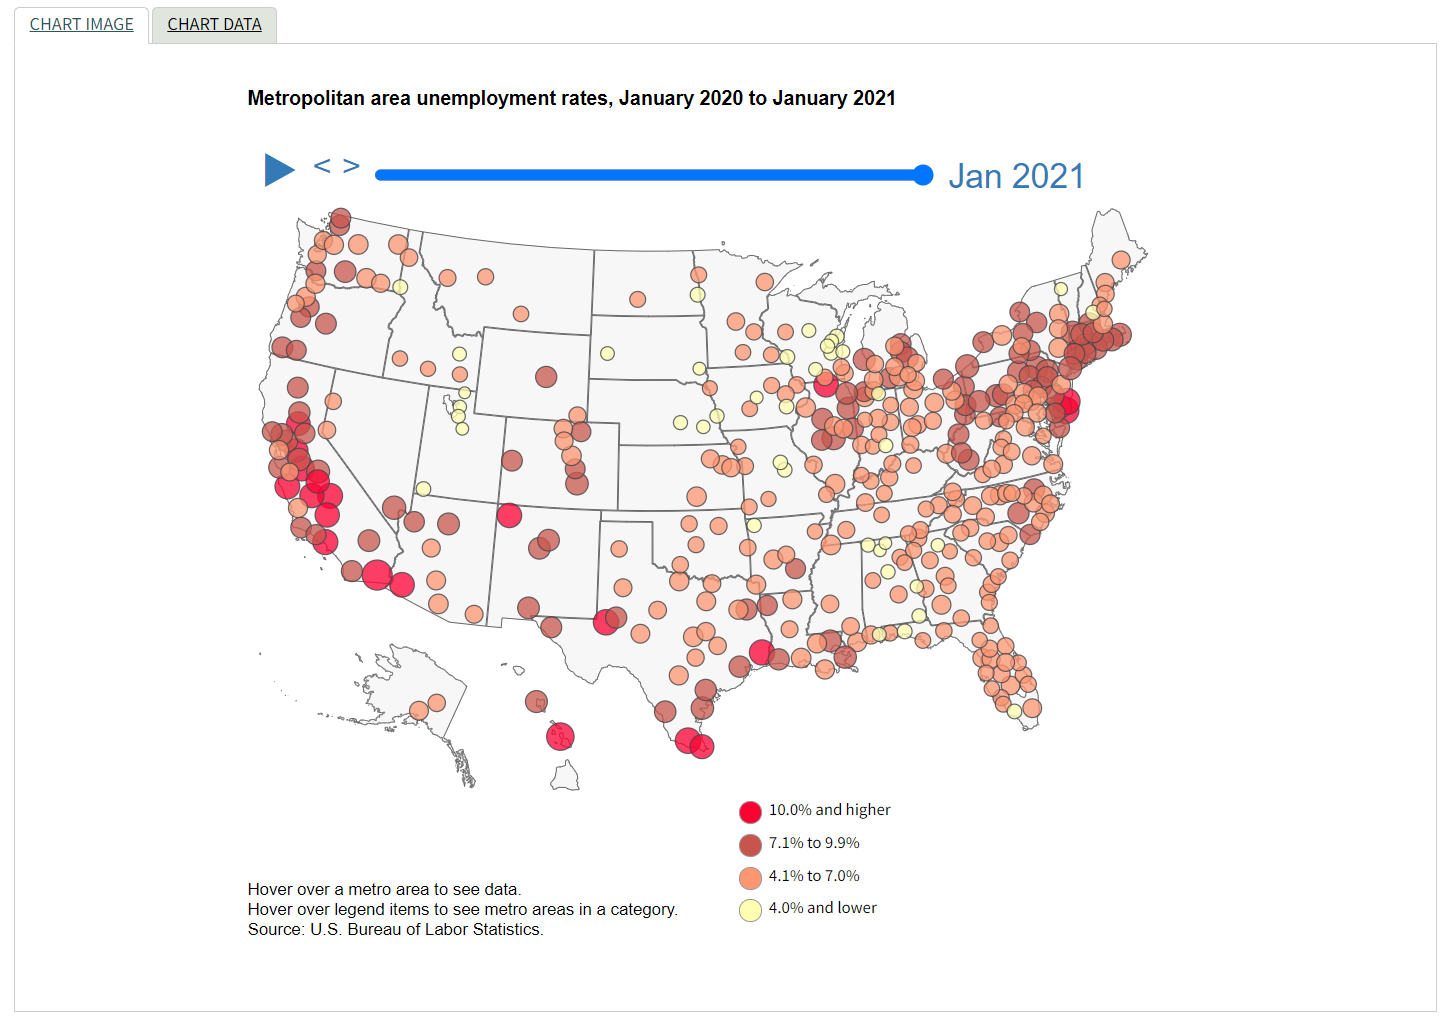
 The U.S. Bureau of Labor Statistics has an interactive graph of unemployment for cities from Jan 2020 to Jan 2021.
Unemployment rates were higher in January 2021 than a year earlier in 376 of the 389 metro areas, lower in 9 areas, and unchanged in 4 areas. The largest over-the-year unemployment rate increase occurred in Kahului-Wailuku-Lahaina, Hawaii. Rates rose over the year by at least 5.0 percentage points in an additional 11 areas.
Unemployment rates were 10.0 percent or higher in 21 metro areas in January 2021. This was greater than the 4 areas with unemployment rates of at least 10.0 percent in January 2020 but much less than the 339 areas in April 2020, at the onset of the COVID-19 pandemic.
The data is available on the page and provides unemployment rates for metropolitan areas from Jan 2020 to Jan 2021.