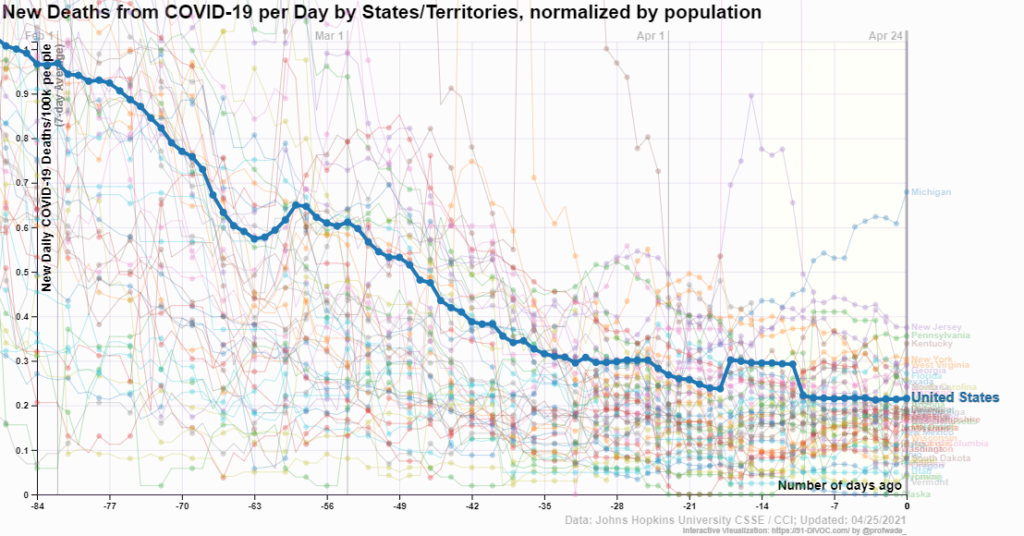
 The media tends to focus on extremes and generally bad ones at that. If you focus on Michigan one would come to believe that things aren’t improving much with COVID-19. The graph here is from 91-DIVOC, which has a number of interactive graphs, along with making the data available. Over the last 12 weeks deaths are down about 1/5 and only one state is really going against the downward trend. The trend should continue downward as more folks are vaccinated, so please get vaccinated. Note: At this point we are passing half the U.S. adult population vaccinated.
Tags charts and graphs data source
Check Also
How do vaccination rate differ?
The Pew article Increasing Public Criticism, Confusion Over COVID-19 Response in U.S. by Alec Tyson …