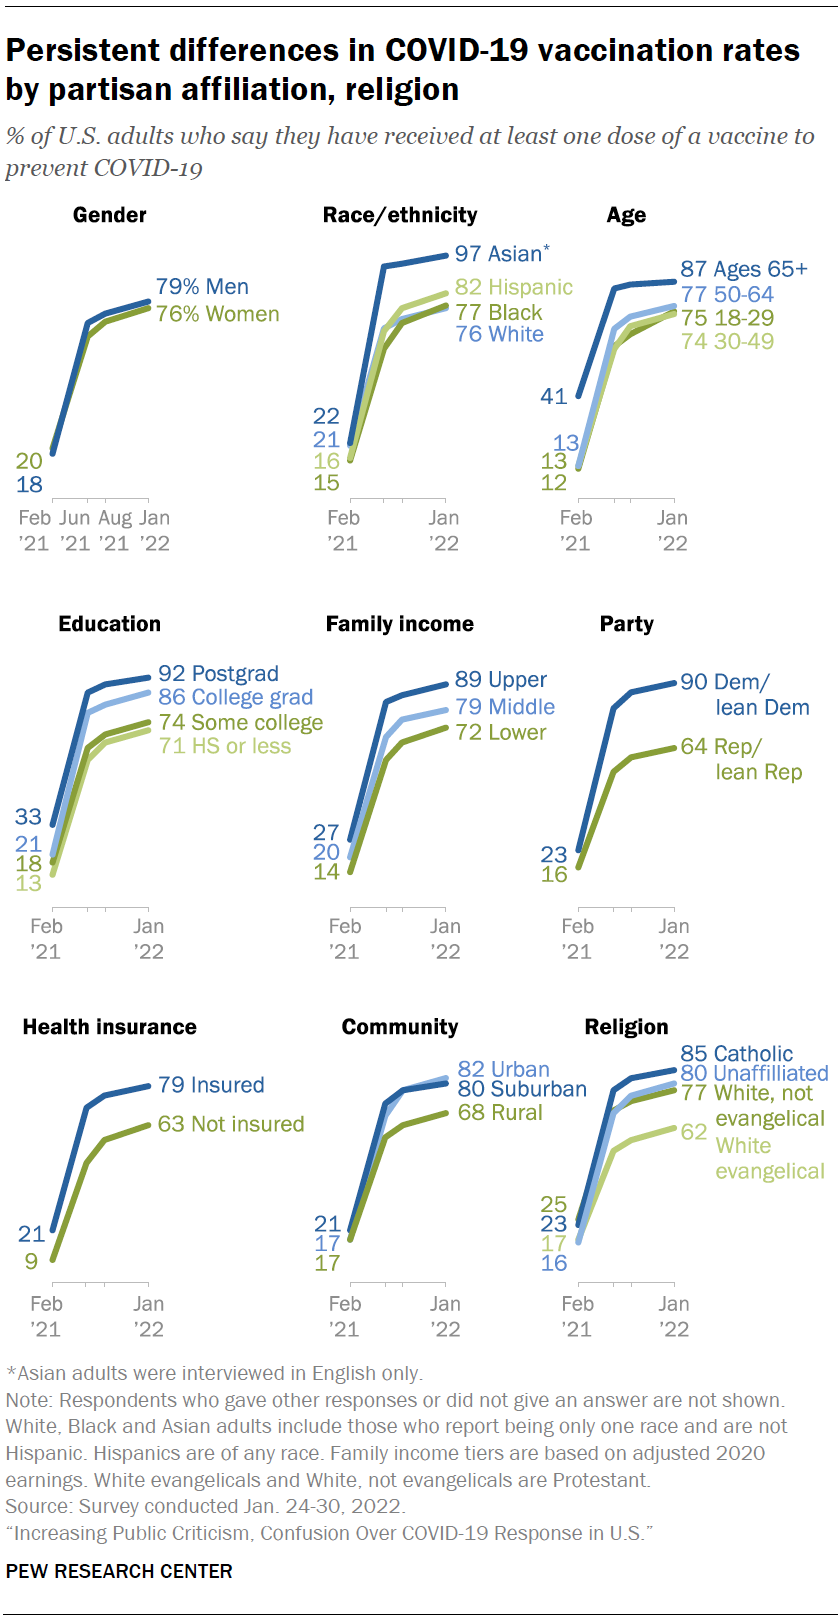
The Pew article Increasing Public Criticism, Confusion Over COVID-19 Response in U.S. by Alec Tyson and Cary Funk (2/9/2022) has the graph copied here, which seems unrelated to the title but is interesting. I’ll leave you to decide what is surprising and what isn’t. Further:
Some demographic differences in vaccination status are more pronounced within one partisan group than another. For instance, 80% of Republicans ages 65 and older say they have received a COVID-19 vaccine, compared with far fewer Republicans 18 to 29 (52%). There is a much more modest gap between the shares of Democrats 65 and older and those 18 to 29 who say they’ve received a vaccine (94% vs. 88%). See the Appendix for more details on vaccination status within partisan groups.
This all seems like good data for statistical tests. There are more graphs, a methodology section, and more data.