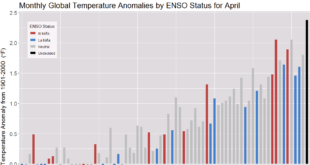
 NCICS (North Carolina Institute for Climate Studies) hosts the State Climate Summaries page. On this page you can select a state to arrive at a climate summary for the state. For example, the NYS page has ten graphs, including the one copied here, and summaries such as
Since the beginning of the 20th century, temperatures in New York have risen almost 2.5°F, and temperatures in the 2000s have been higher than in any other historical period (Figure 1). As of 2020, the hottest year on record for New York was 2012, with a statewide average temperature of 48.8°F, more than 4°F above the long-term average (44.5°F). This warming has been concentrated in the winter and spring, while summers have not warmed as much (Figures 2a and 2b). Summer warming is more influenced by the number of warm nights than by the occurrence of very hot days (Figures 2c and 2d). The state has experienced an increase in the number of warm nights and a decrease in the number of very cold nights (Figure 3). The increase in winter temperatures has had an identifiable effect on Great Lakes ice cover. Since 1998, there have been several years when Lakes Erie and Ontario were mostly ice-free (Figure 4).
A great site that allows educators to plan lessons around their state.
