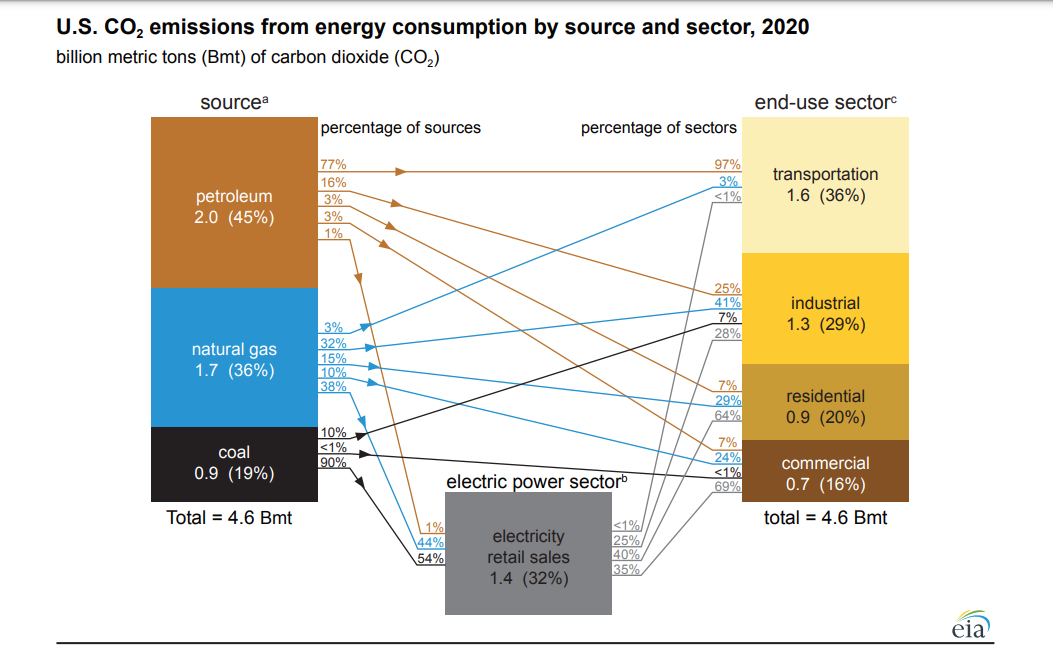
The eia diagram U.S. CO2 emissions from energy consumption by source and sector 2020 provides information on the source of CO2 and how that source is used. Archived energy flow diagrams and energy consumption graphs can be found on the Monthly Energy Review page, along with lots of data.