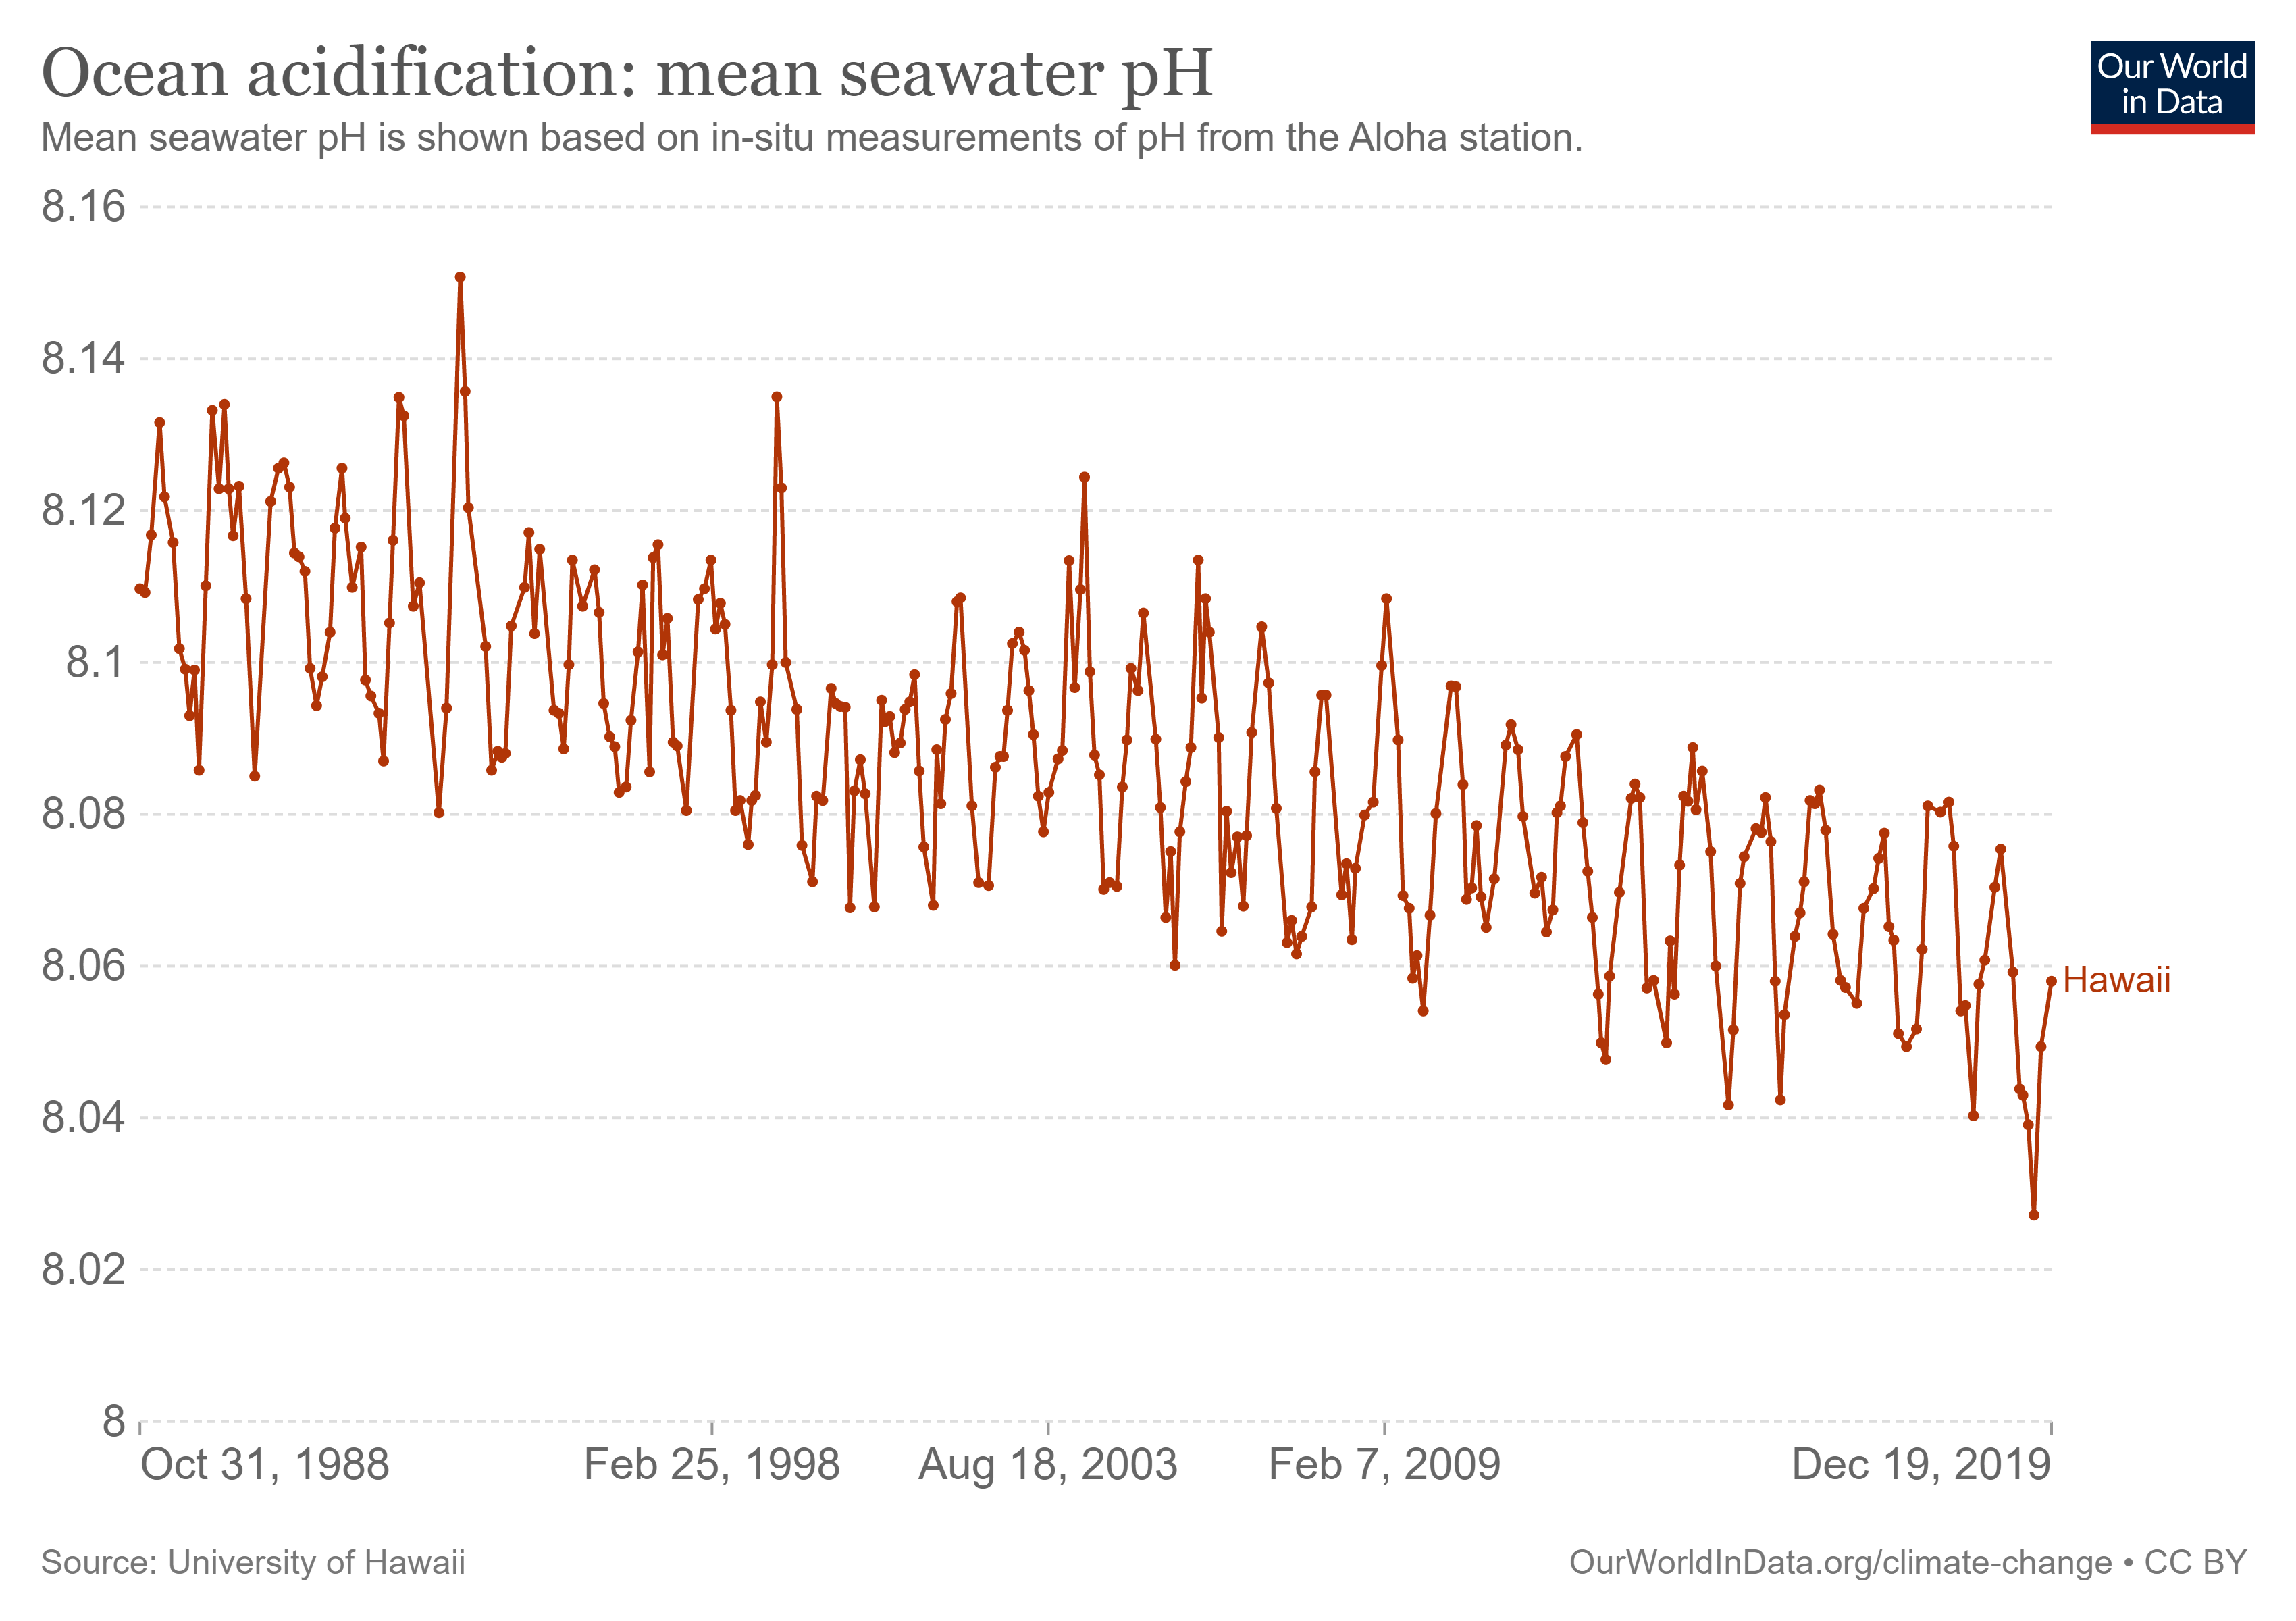
 Our World in Data now has a Climate Change Impacts Data Explorer. It is a one stop shopping for fourteen different measures such as temperature anomalies, sea level rise, arctic sea ice and ocean ph (the graph here). In many cases there are multiple locations or data sets. In each case the data and the graph can be downloaded.
Quiz question: The ph data has a clear seasonality, why?