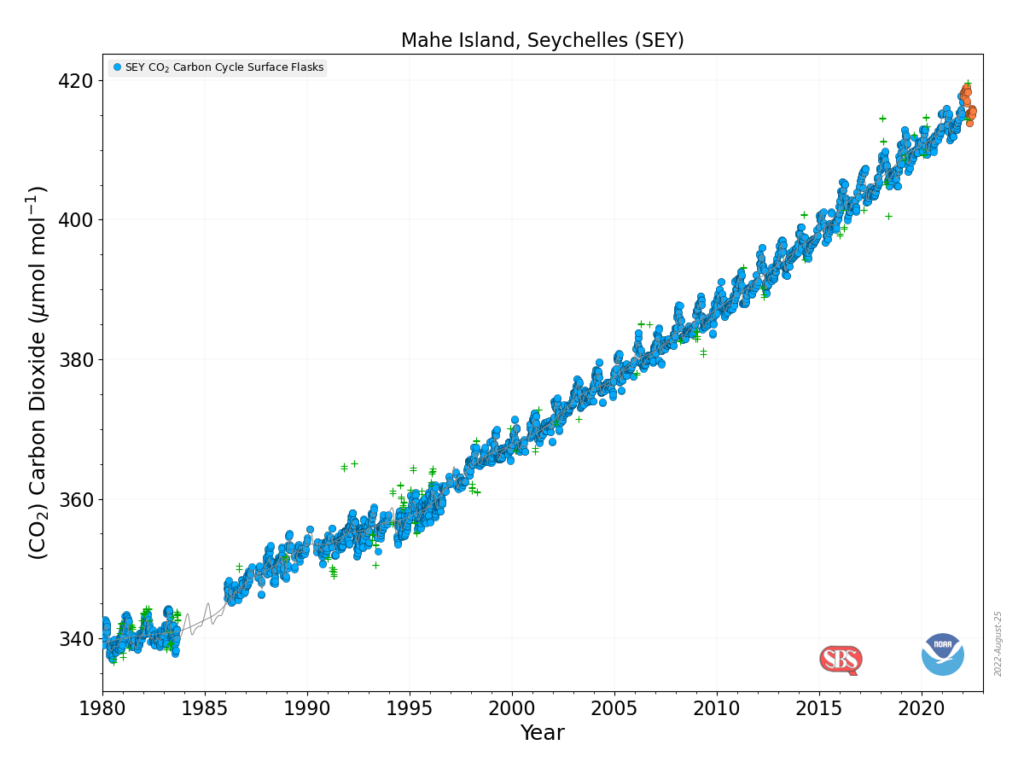
 Back to more serious data stuff today. Now, you may have been wondering where to get a visualization and the data for CO2 measurements collected on Mahe Island, Seychelles. All you have to do is start on NOAA’s Global Monitoring Laboratory where you will find a map with a bunch of dots around the world. Each dot represents a monitoring station. When you run the cursor over the data it tells you what data is collected at that location. Click the dot and then select what you’d like on the right sidebar. A new page will open for a few more choices. In the end you can get a graph, such as the one here, and a link to the data. Enjoy.
Tags charts and graphs data source
