From the eia article Monthly U.S. propane exports in March 2023 reached a record high by Josh Eiermann (6/6/2023) U.S. propane exports reached a record 1.7 million barrels per day (b/d) in March 2023, the highest level since we began collecting this data in 1973. Propane is consumed globally for space heating …
Read More »How much crude oil will the U.S. produce?
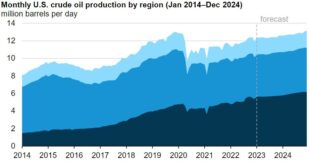
According to the eia article U.S. crude oil production will increase to new records in 2023 and 2024 by Matthew French, Alexander DeKeyserling, Naser Ameen (1/25/2023): …we forecast that crude oil production in the United States will average 12.4 million barrels per day (b/d) in 2023 and 12.8 million b/d …
Read More »What should we know about oil markets?
The World Bank blog post Oil prices remain volatile amid demand pessimism and constrained supply by Peter Nagle and Kaltrina Temaj (12/16/2022) is a overview of the oil market. There are seven graphs but one, U.S. strategic reserves, caught my attention and is copied here. The United States and other …
Read More »How much natural gas does the industrial sector use?
The eia post Natural gas consumption in the industrial sector has grown slowly in recent years by Mike Kopalek (12/12/2022) provides the graph copied here. What may be more interesting is what all this natural gas is used for. A few highlights: Natural gas used to produce fertilizer is one …
Read More »Where is the coal and the coal jobs?
An interesting post by the eia and the title answers the question: Most U.S. coal is mined in the West, but most coal mining jobs are in the East by Elesia Fasching (11/8/2022). In 2021, 60% of the country’s coal was produced in the western United States, but only 28% …
Read More »How much do the top ten oil producers produce?
Our World in Data now has a Fossil Fuels Data Explorer. You can create a time series of the top ten oil producers, download the image, and post it on your favorite blog, which I did. Each of the top three more than doubles any producer in the 4-10 spot. …
Read More »What are the sources of methane emissions in the U.S.?
The iea has a Methane Tracker Data Explorer which has information of methane emissions by country or for the world. In 2021 the U.S. emitted 31,460 kt of methane which is 8.8% of the global emissions. There are various graphs, such as the one copied here, and links to download …
Read More »How much CO2 have we emitted in the last 30 years?
The Institute for European Environmental Policy had this post that I missed in 2020 but it is still good: More than half of all CO2 emissions since 1751 emitted in the last 30 years (4/29/2020). Slightly over half of all cumulative global CO2 emissions have taken place since 1990, the …
Read More »How much LNG do we export?
The eia article U.S. natural gas net trade is growing as annual LNG exports exceed pipeline exports by Kristen Tsai (8/16/2021) has the chart here that answers the question. In our August 2021 Short-Term Energy Outlook (STEO), we forecast that U.S. natural gas exports will exceed natural gas imports by an average …
Read More »What is the source and end-use of CO2 emissions?
The eia diagram U.S. CO2 emissions from energy consumption by source and sector 2020 provides information on the source of CO2 and how that source is used. Archived energy flow diagrams and energy consumption graphs can be found on the Monthly Energy Review page, along with lots of data.
Read More »

