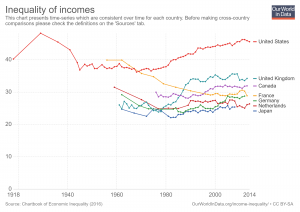
 Our World in Data has an interactive chart that compares income inequality with gini coefficients. For example the chart here has the United States, United Kingdom, France, Germany, Netherlands, and Japan (you can select other countries too). Of these six countries the U.S. has greater income inequality than the other five. It has also grown considerably since the mid 1970s. As always with Our World in Data, you can download the data set so it can be used in statistics courses. You can also download graphs, such as the one here.
Is America’s nutritional divide due to food deserts?
 In a recent article by Richard Florida, It’s Not the Food Deserts: It’s the Inequality, the case is made that food deserts aren’t the real problem.
Instead of within cities, the biggest geographic differences in the way Americans eat occur across regions. The map above plots the geography of healthy versus unhealthy eating across America’s 3,500-plus counties. Dark red indicates a lower health index based on grocery purchases, while light yellow represents a higher health index. While there is some variation within cities and metro areas, by far the biggest and most obvious differences are across broad regions of the country.
Ultimately, the fundamental difference in America’s food and nutrition has more to do with class than location. More than 90 percent of the difference in Americans’ nutritional inequality is the product of socioeconomic class, according to the study. And it’s not just that higher-income Americans have more money to spend on food. In fact, the cost of healthy food is not as prohibitively high as people tend to think. While healthy food costs a little bit more than unhealthy food, most of that is driven by the cost of fresh produce.
The article has useful graphs and summary statistics and can be used in QL or statistics based course.
What do you know about the top 1%?
The Chicago Booth post, Never mind the 1 percent Let’s talk about the 0.01 percent, provides an insightful summary of income distribution at the top.
Mankiw noted that the 1 percent’s share of total income, excluding capital gains, rose from about 8 percent in 1973 to 17 percent in 2010, the latest figures available at the time. “Even more striking is the share earned by the top 0.01 percent. . . . This group’s share of total income rose from 0.5 percent in 1973 to 3.3 percent in 2010. These numbers are not easily ignored. Indeed, they in no small part motivated the Occupy movement, and they have led to calls from policymakers on the left to make the tax code more progressive.”
There is detailed exposition on who makes up the top and how they got there. For instance,
Technology, from the internet to media such as ESPN and Bloomberg terminals, has given elite athletes, entertainers, entrepreneurs, and financiers the ability to profit on a much larger, global scale, making the fruits of their labor more valuable than what previous superstars, such as, say, Pelé or Babe Ruth, brought in. Ruth’s peak salary of $80,000 would be worth about $1.1 million in 2016 dollars, around one-thirtieth of the $33 million the highest-paid Major League Baseball player, pitcher Clayton Kershaw of the Los Angeles Dodgers, made in salary alone in 2016.
And hedge-fund managers make multiples more than top athletes and entertainers. James Simons of Renaissance Technologies and Ray Dalio of Bridgewater Associates each made more than $1 billion in 2016, even though, as Institutional Investor’s Alpha reported, the top-25 hedge-fund earners took in the least as a group since 2005, largely because of the industry’s overall poor investment performance.
This is an excellent article about income and how it is distributed, with a number of graphs suitable for QL based courses.
What is the pay gap between Hispanic women vs white non-Hispanic men?
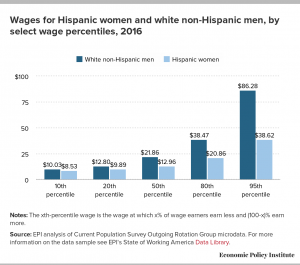 The Economic Policy Institute has the answer with their post Latina workers have to work 10 months into 2017 to be paid the same as white non-Hispanic men in 2016. They compare not only wages by percentile (graph here), but also compare by occupation and education.
Much of these differences are grounded in the presence of occupational segregation. Latina workers are far more likely to be found in certain low-wage professions than white men are (and less common in high-wage professions). But, even in professions with more Latina workers, they still are paid less on average than their white male colleagues.
As Hispanic women increase their educational attainment, their pay gap with white men actually increases. The largest dollar gap (more than $17 an hour), occurs for workers with more than a college degree.
The EPI post includes downloadable graphs (such as the one here) as well as the data.
CEOs Still Doing Fine
 The EPI has detailed report on CEO pay, CEO pay remains high relative to the pay of typical workers and high-wage earners. The article includes data, such as the ratio of CEO-to-worker pay that was used to create the graph here. Although the ratio has decreased since its peak of 347.5 in 2007, it was still a healthy 270.5 in 2016, which is over 10 times the 20 it was in 1965. From the report:
From 1978 to 2016, inflation-adjusted compensation, based on realized stock options, of the top CEOs increased 937 percent, a rise more than 70 percent greater than stock market growth and substantially greater than the painfully slow 11.2 percent growth in a typical worker’s annual compensation over the same period. CEO compensation, when measured using the value of stock options granted, grew more slowly from 1978 to 2016, rising 807 percent—a still-substantial increase relative to every benchmark available.
Over the last three decades, compensation, using realized stock options, for CEOs grew far faster than that of other highly paid workers, i.e., those earning more than 99.9 percent of wage earners. CEO compensation in 2015 (the latest year for data on top wage earners) was 5.33 times greater than wages of the top 0.1 percent of wage earners, a ratio 2.15 points higher than the 3.18 ratio that prevailed over the 1947–1979 period. This wage gain alone is equivalent to the wages of more than two very-high-wage earners.
As noted, the report which is worth reading, has data that can be used in the classroom and ample quantitative information for QL based classes.
How Big is the Pay Gap Between Black Women and White Men?

A recent article, Black women have to work 7 months into 2017 to be paid the same as white men in 2016, from the EPI answers this question. The article has pertinent comparisons.
Myth #2: Black women can educate themselves out of the pay gap.
The truth: Two-thirds of black women in the workforce have some postsecondary education, 29.4 percent have a bachelor’s degree or higher. Black women are paid less than white men at every level of education.
There are three tables/charts, such as the one here, with the data so it can be used in a classroom. The EPI maintains a data that was highlighted in this blog’s post Data Spotlight: Employment and Wages by Race and Gender.
NOTE: Sustainability Math now has a Twitter account. Consider following @SustMath
Life Expectancy vs Income Per Person
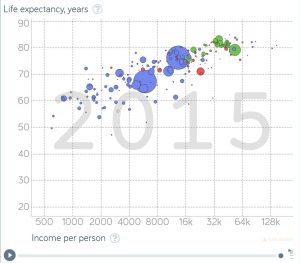 With health care in the news, let’s take a look at the knowledge that can be gained by using Gapminder. For example, the graph here is life expectancy vs income per person for 2015, with the bubbles representing population size of the country. Can you guess the bubble for the U.S.? Go to the graph on Gapminder to find out. As a bonus their is a play button so that the graph will scroll from 1800 to 2015. You will also find a number of tools to change the graph and create others. All the data used by the Gapminder graphs is located on their data page.
New Data: Pretax Income Growth
 How much has pretax income grown by earner percentiles? The graph here, from Chicago Booth Review’s article New Data: Inequality Runs Deeper than Previously Thought, provides the answer.
So Piketty, Saez, and Gabriel Zucman of University of California at Berkeley combined tax, survey, and national-accounts data to create distributional accounts that they say capture 100 percent of US income since 1913. The new accounts include transfer payments, employee fringe benefits, and capital income, which weren’t in previous data.
The data set reveals since 1980 a “sharp divergence in the growth experienced by the bottom 50 percent versus the rest of the economy,” the researchers write. The average pretax income of the bottom 50 percent of US adults has stagnated since 1980, while the share of income of US adults in the bottom half of the distribution collapsed from 20 percent in 1980 to 12 percent in 2014. In a mirror-image move, the top 1 percent commanded 12 percent of income in 1980 but 20 percent in 2014. The top 1 percent of US adults now earns on average 81 times more than the bottom 50 percent of adults; in 1981, they earned 27 times what the lower half earned.
If you click on the top right of the graph in the article and go to edit chart you can get a table of the data used for the chart. Great for use in a QL or stats course. Of course Piketty and Saez are know for creating the World Wealth and Income Database, which we have highlighted on this blog before.
Data Spotlight: Income Inequality
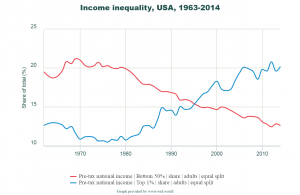 If you are looking for data on wealth and income inequality visit the World Wealth and Income Database. You can create graphs and download the data. For example, the graph here is pre-tax share of income for the top 1% (20.2% in 2014) and bottom 50% (12.6% in 2014) of adults in the U.S. The trends since 1980 are roughly linear and so the data, which you can download in a number of formats, can be used for regression. Once you have the lines, they can be used in other places in the curriculum. Other categories exist including wealth instead of income and groups such as the top 10% or middle 40%.