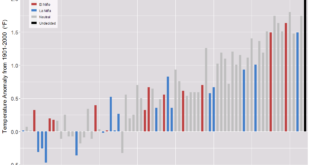
 The New York Times interactive article How Much Hotter Is Your Hometown Than When You Were Born? By Nadja Popovich, Blacki Migliozzi, Rumsey Taylor, Josh Williams and Derek Watkins, allows the reader to input a birth year and hometown and provides a graph with historical 90+ degree days and predictions for the future. For example a person born in 1970 in NYC would get the graph copied here. In 1970 the expectation was six 90+ degree days, today it is 11, and by 2050 it will be 24 with a likely range of 15 to 30.
THE NEW YORK AREA is likely to feel this extra heat even if countries take action to lower their emissions by the end of the century, according to an analysis conducted for The New York Times by the Climate Impact Lab, a group of climate scientists, economists and data analysts from the Rhodium Group, the University of Chicago, Rutgers University and the University of California, Berkeley. If countries continue emitting at historically high rates, the future could look even hotter.
The future projection shown here assumes countries will curb greenhouse gas emissions roughly in line with the world’s original Paris Agreement pledges (although most countries do not appear on track to meet those pledges).
There are related human health impacts:
Worldwide, high temperatures have been found to increase the risk of illness and death, especially among older people, infants and people with chronic medical conditions. Lower-income populations, which more often lack access to air conditioning and other adaptive technologies, are also more likely to suffer the impacts of extreme heat. In America, so are people of color.
The article has other graphs and quantitative information which can be used in QL based course.
