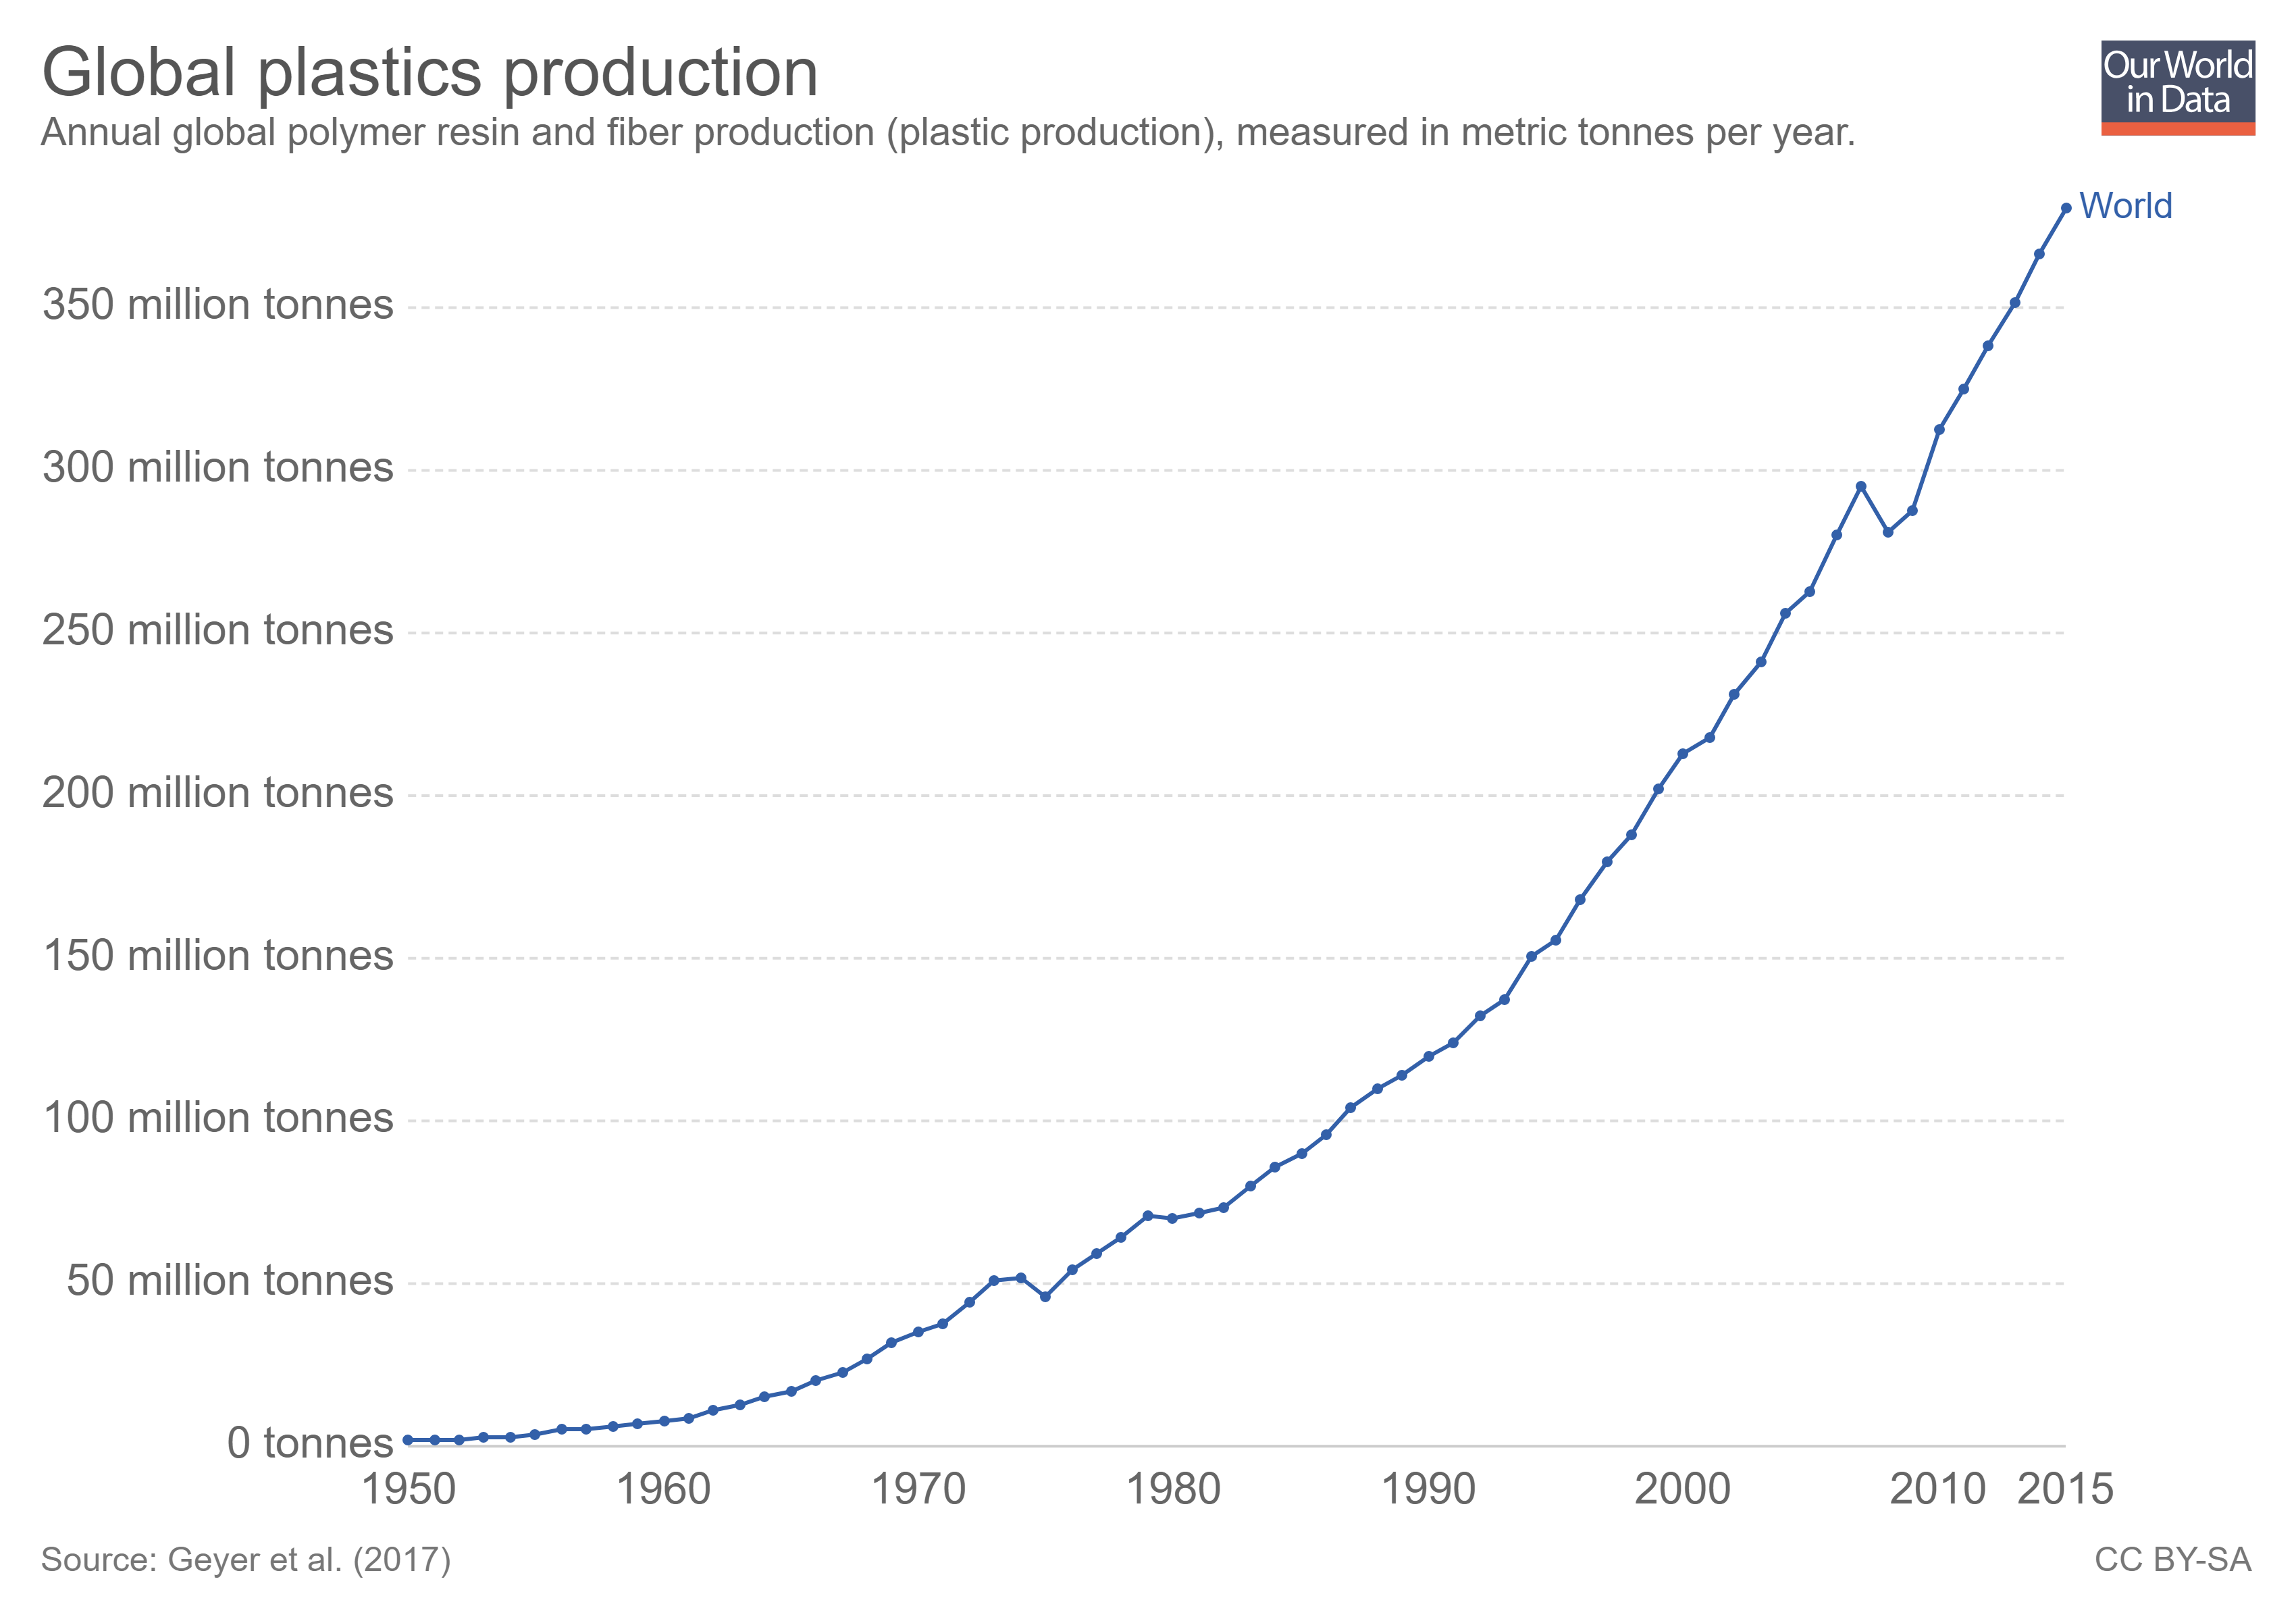
 The Our World in Data article Plastic Pollution by Hannah Ritchie and Max Roser (Sept 2018) is a detailed summary of plastics with 20 charts. For example, one of the charts is a time series of plastic production (downloaded and posted here) showing that, in 2015, the world produced 381 million tons of plastic. In the same year, only 20% of the plastic was recycled (second chart in the article). There is information on plastic waste generation.
Packaging, for example, has a very short ‘in-use’ lifetime (typically around 6 months or less). This is in contrast to building and construction, where plastic use has a mean lifetime of 35 years.7 Packaging is therefore the dominant generator of plastic waste, responsible for almost half of the global total.
Who produces the most plastic waste?
… we see the per capita rate of plastic waste generation, measured in kilograms per person per day. Here we see differences of around an order of magnitude: daily per capita plastic waste across the highest countries – Kuwait, Guyana, Germany, Netherlands, Ireland, the United States – is more than ten times higher than across many countries such as India, Tanzania, Mozambique and Bangladesh.
As always with Our World in Data, the data associated with each graph is downloadable.