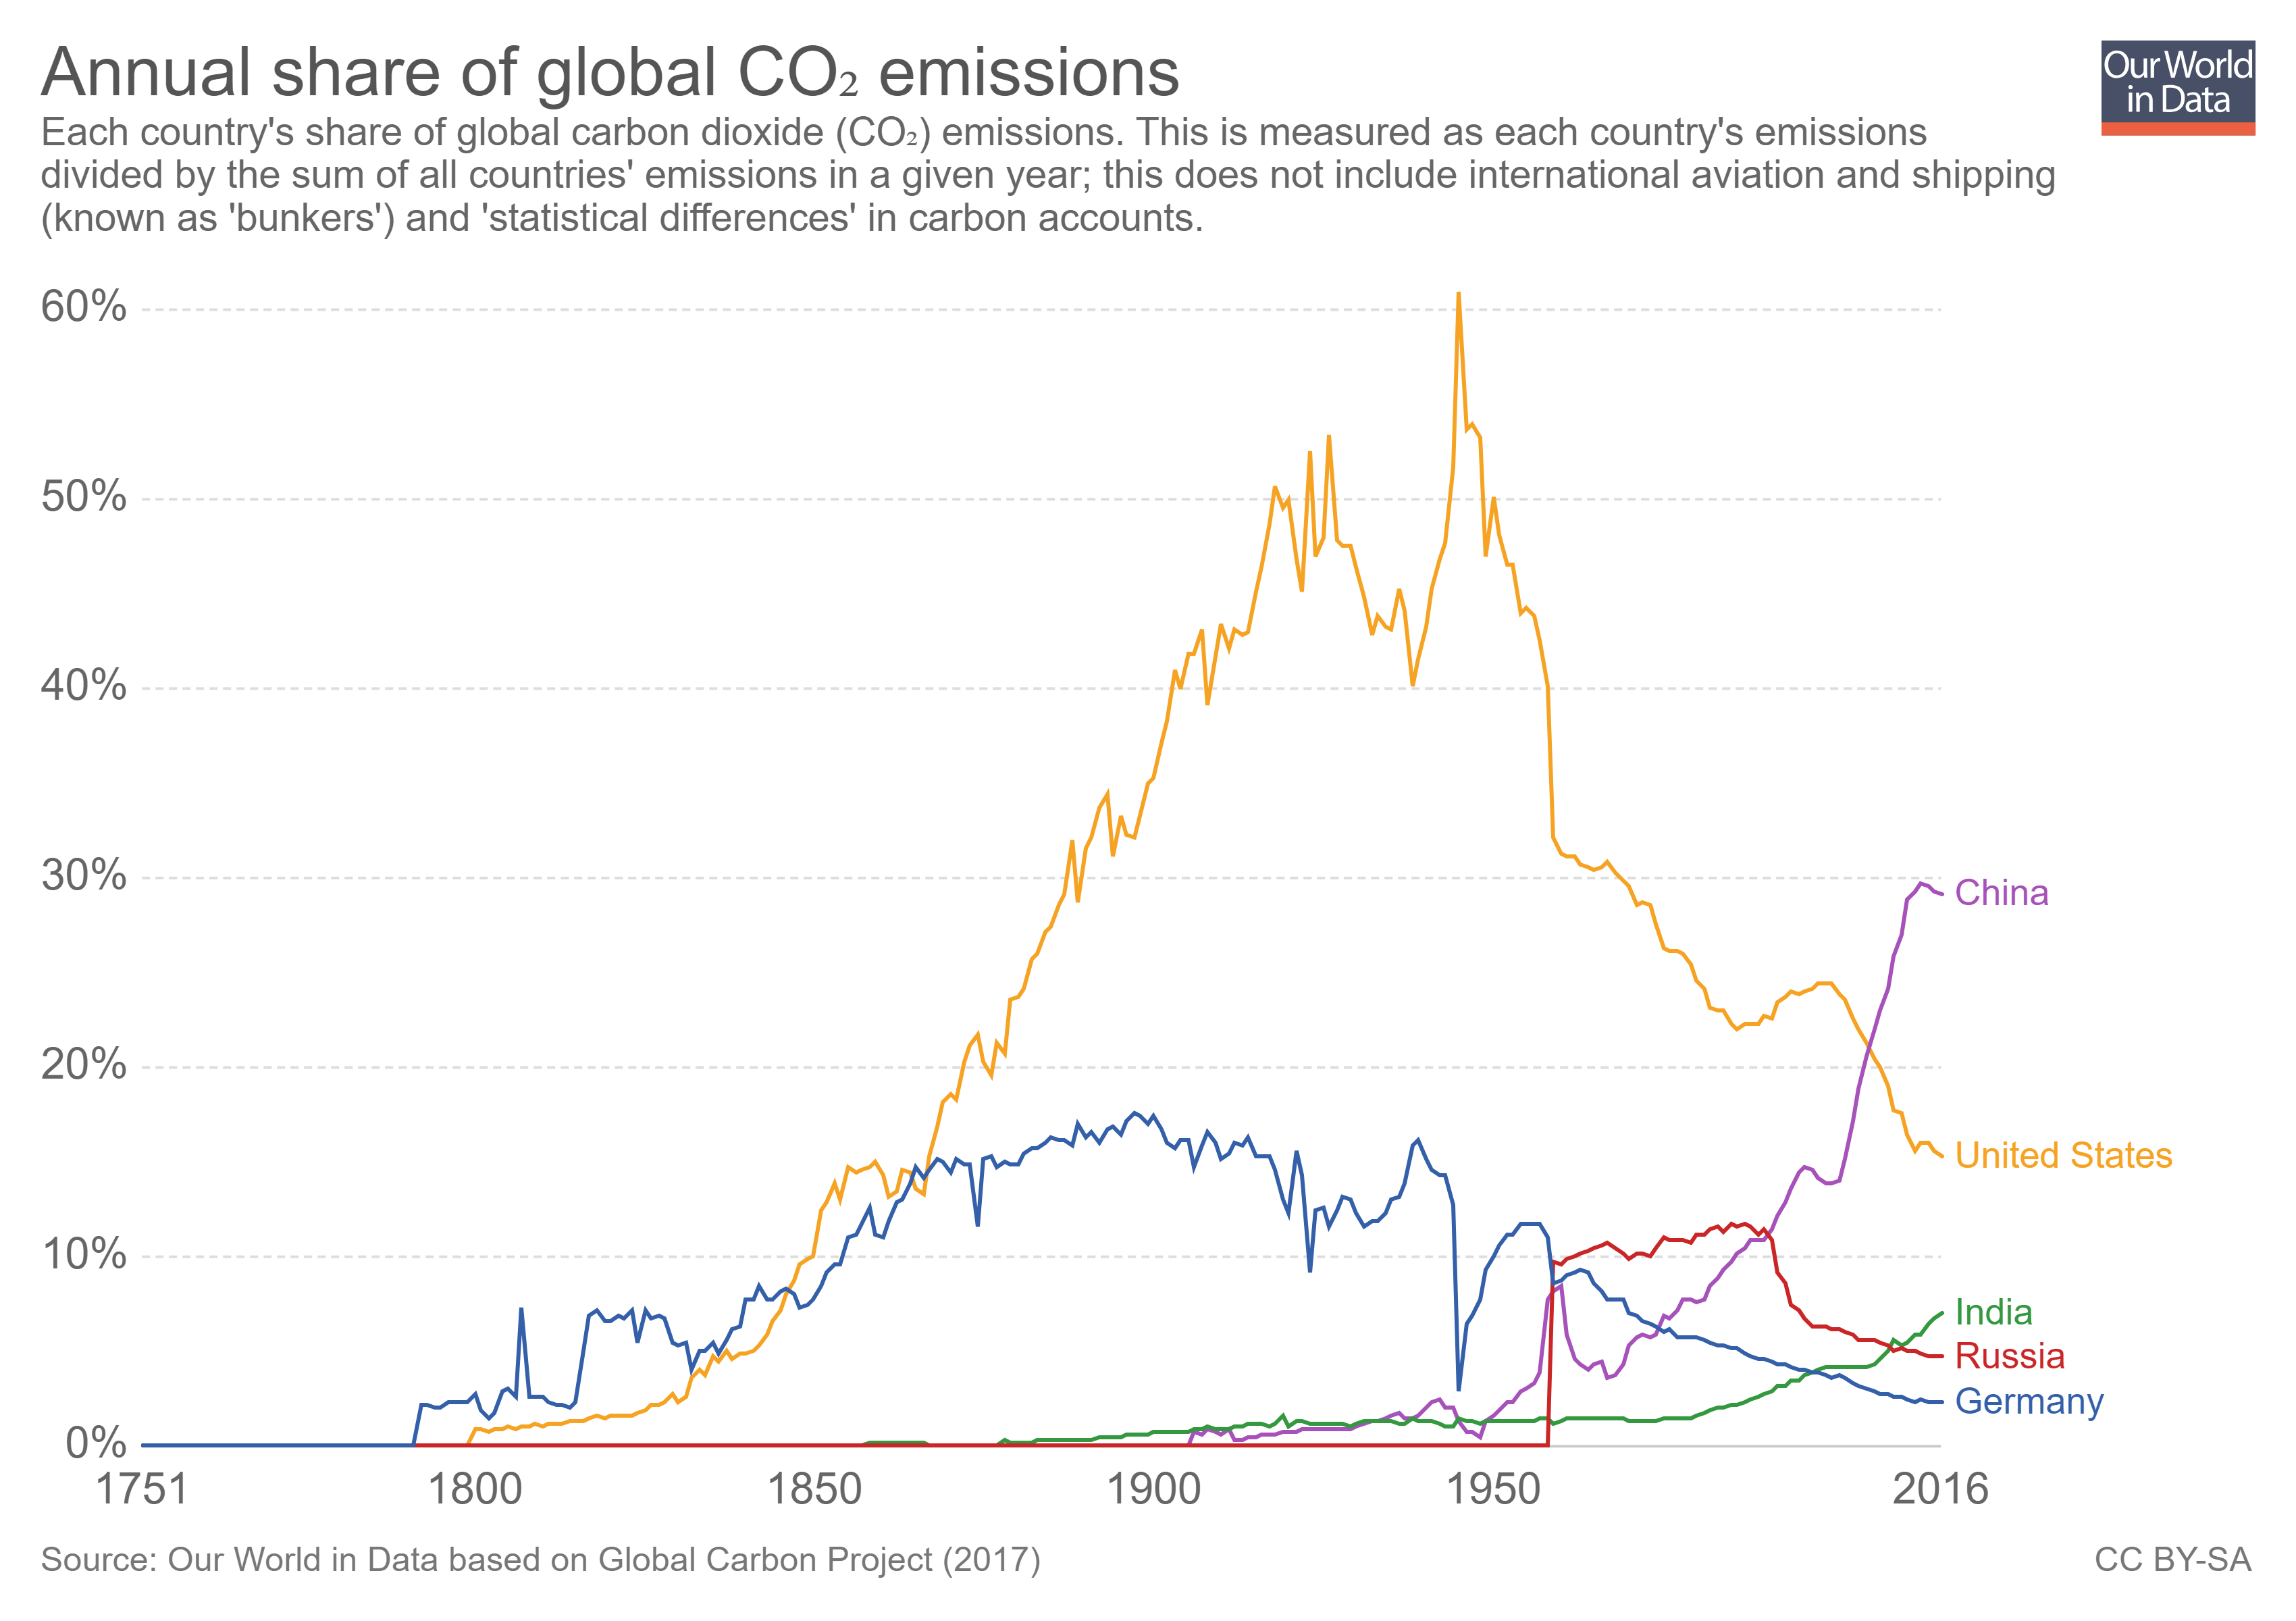
 The country that emits the most CO2 depends on how it is measured. Our World in Data has a graph of annual share of CO2 emissions by country. By this measurement, a graph with the top 5 countries (China, U.S., India, Russia, & Germany) in 2016 was downloaded from Our World in Data. In this case, China has been the largest contributor of CO2 since 2005. In fact, in 2016 China emitted 10,295 million metric tons of CO2 compared to 5,240 million metric tons by the U.S. On the other hand, from EIA data, in 2016 each person in China emitted 7.3 tons of CO2 compared to a person in the U.S. at 16.2 tons. The EIA data dates back to 1980, and from 1980 to 2106 China emitted 177,547 million metric tones of CO2 compared to 197,176 for the U.S. Which is more important, per person, current, or total historical emissions? How does this create challenges in climate talks? Further analysis with other countries can be done with EIA data. Data can also be downloaded from the Our World in Data post. The Calculus Projects page has an example of using this data in a calculus class.
Tags charts and graphs climate change CO2 data source
About Thomas J. Pfaff
Check Also
The End is Near
I expect to shut down this site by the end of the summer (2026). I …