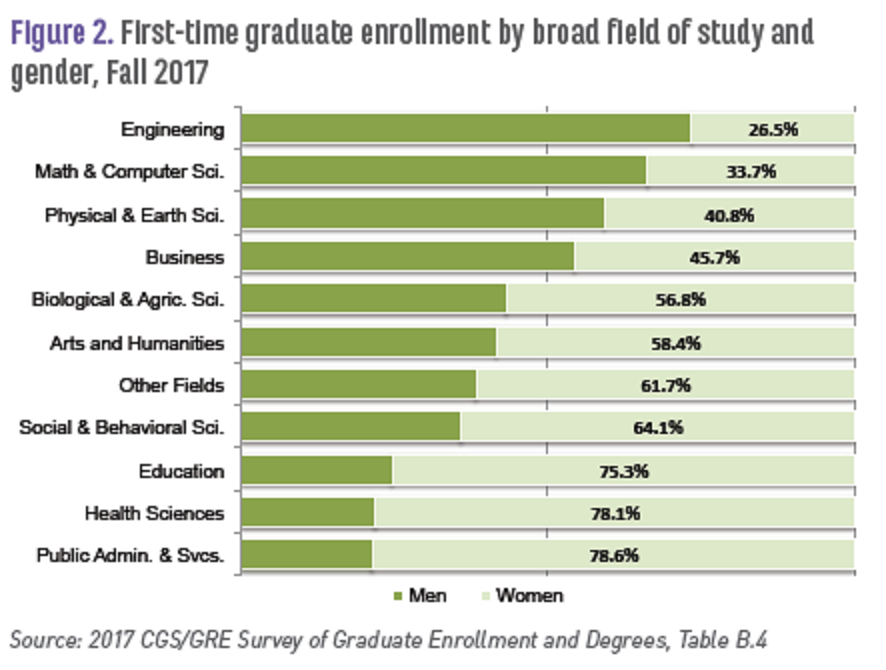
 The Council of Graduate Schools (CGS) report, Graduate Enrollment and Degrees 2007 to 2017 (Oct 2018) provides data on enrollment and degrees in graduate school by gender and race. For example, the graph here is Figure 2 in their report and provides enrollment data by field of study and gender. In the aggregate they note:
Academic year 2016-17 marked the eighth consecutive year in which women earned the majority of degrees awarded at the doctoral level. Women earned 64.0% of graduate certificates awarded in 2016-17, 57.3% of master’s degrees, and 53.0% of doctorates.
The report contains a number of graphs and data tables with various demographic information (race, gender, international). For example,
Among first-time U.S. citizens and permanent resident graduate students in the Fall of 2017, about 23.9% were underrepresented minorities, including American Indian/Alaska Native (0.5%), Black/African American (11.9%), Native Hawaiian/Other Pacific Islander (0.2%), and Hispanic/Latino (11.3%) (Table B.11).
A summary page of the report, First-Time Enrollment Holds Steady – Application Counts Slightly Decline at U.S. Graduate Schools, also has a link to the full pdf report.
