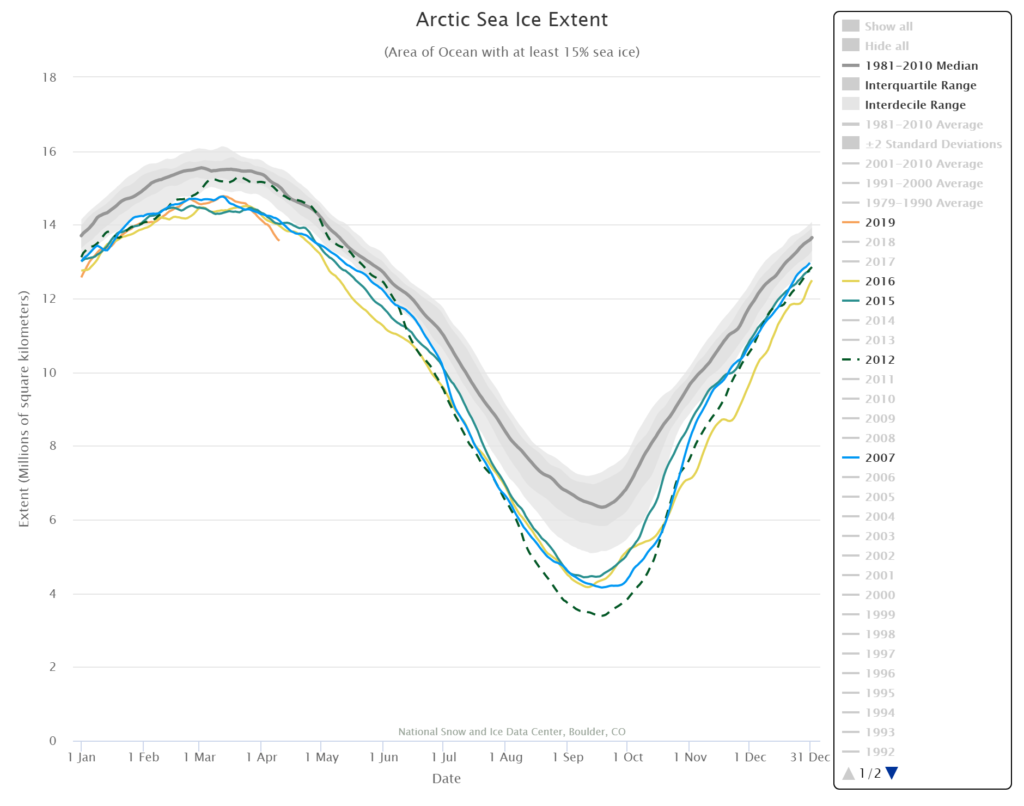
The melting season for Arctic Sea Ice has started with a quick drop in ice. The total ice is at a record low for this time of year (orange line in chart). But, how this plays out throughout the melting seasons is hard to predict based solely on past seasons. For instance, 2012 is the year of the record low (dashed line), but numerous seasons have been lower than 2012 at this time of year (2016 – yellow, 2015 – green, 2007 – blue shown here). Arctic Sea Ice extent is updated daily on the Charctic Interactive Sea Ice Graph by NSIDC. This graph allows the user to select years, download the image, and choose between Arctic and Antarctic ice extent. NSIDC posts the data and there is a project on both the Calculus and Statistics page using this data, as well as an interactive graph.

