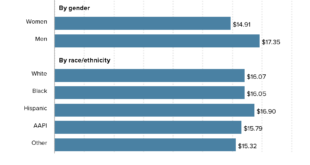
The Brookings report Meet the low-wage workforce by Martha Ross and Nicole Bateman (11/7/19) provides demographics of the low-work force by category. The nine categories they use are represented in their chart copied here. For example, cluster 1 are ages 18-24 are not in school and don’t have a college degree. They are 13% of the low-wage workforce. The post has links to the full report where we learn that this cohort is 51% White, 16% Black, 27% Latino or Hispanic, 2% Asian American, and 4% Other. Of this group, 14% didn’t graduate from high school.
There are regional differences:
Across more than 350 metro areas, the share of workers earning low wages ranges from 30% to 62% of the overall workforce. Low-wage workers are particularly concentrated in smaller places in the southern and western parts of the United States. They make up larger shares of the workforce in places with lower employment rates and that concentrate in agriculture, real estate, and hospitality.
The full report contains a number of data tables.

