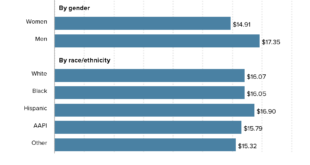
 To find the top charts of 2019 according to EPI see their Top charts of 2019 post. The graph here is #5 on their list.
The figure shows that the real value of the federal minimum wage has dropped 17% since 2009 and 31% since 1968. A full-time worker earning the federal minimum wage today has about $6,800 less per year to spend on food, rent, and other essentials than did his or her counterpart 50 years ago.
There are 13 charts in all with data and links to the original article (for some charts you have to go to the original article to get the data).
