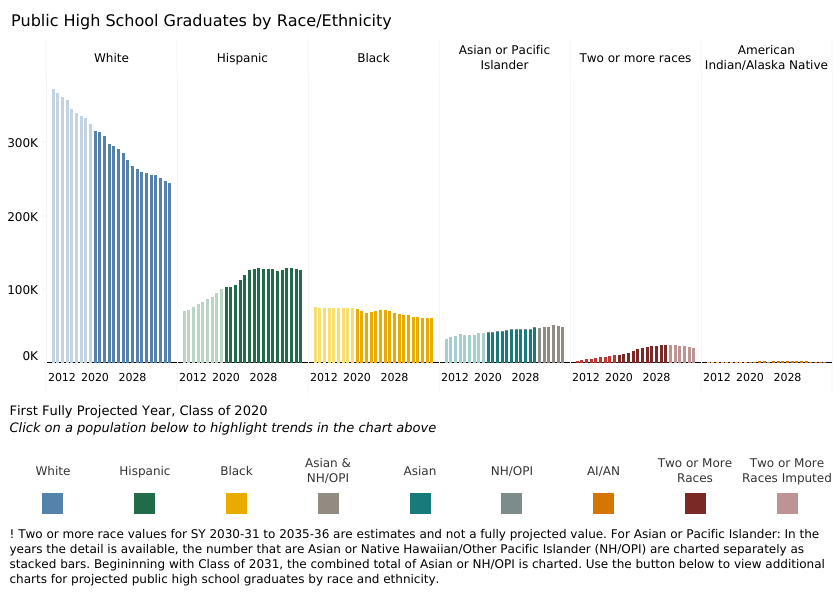
 The last post, What are the projections for high school graduates? provided national high school graduation rates from WICHE. I noted in that post that regional data and reports are available along with race and ethnicity. The graph here (for public high school only) is from the report for the northeast (use the drop down menu to select northeast). There is a wealth of information and available data in the WICHE report.
Tags charts and graphs data source
About Thomas J. Pfaff
Check Also
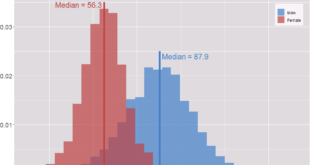
What is the male vs female grip strength difference?
Grip strength is one of the factors measured in the National Health and Nutrition Examination Survey …