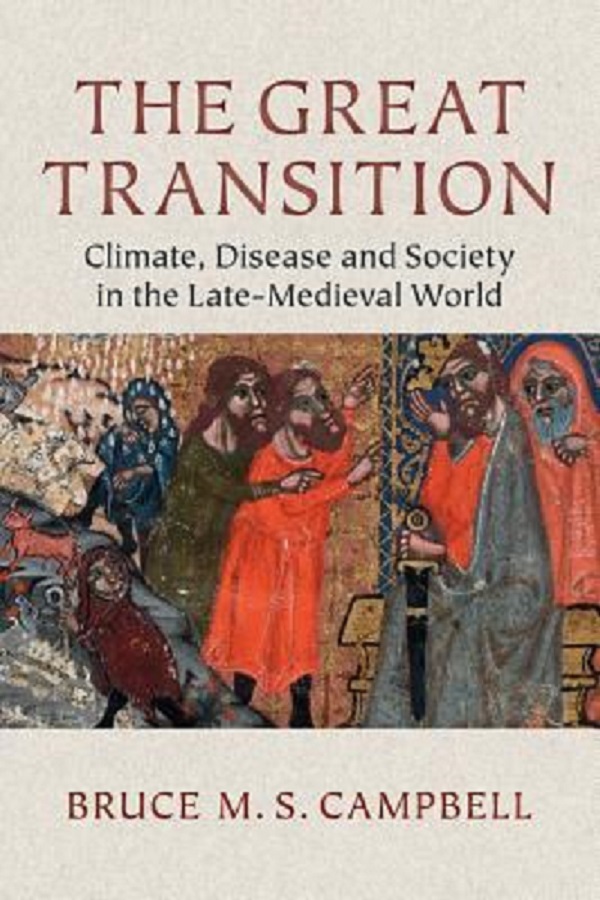
I’ve never done a book recommendation before and that changes today. If you are looking for a book that has about 75 excellent graphs and uses paleoclimatology data to connect changing climate as it impacts society during the time period of roughly 1200 to 1500, then I recommend Bruce M. S. Campbell’s book The Great Transition – Climate, Disease and Society in the Late-Medieval World. The book connects modern science along with data and graphs to tell the story of medieval Europe. I can certainly see this book being used in some form of interdisciplinary seminar or a data science course where student work to reproduce the graphs (of course, you can just read the book for fun). The book pointed me toward the Paleoclimatology Datasets posted at NOAA. The is a lot of data here and it takes some work to get what you might want, but it is a valuable resource.

