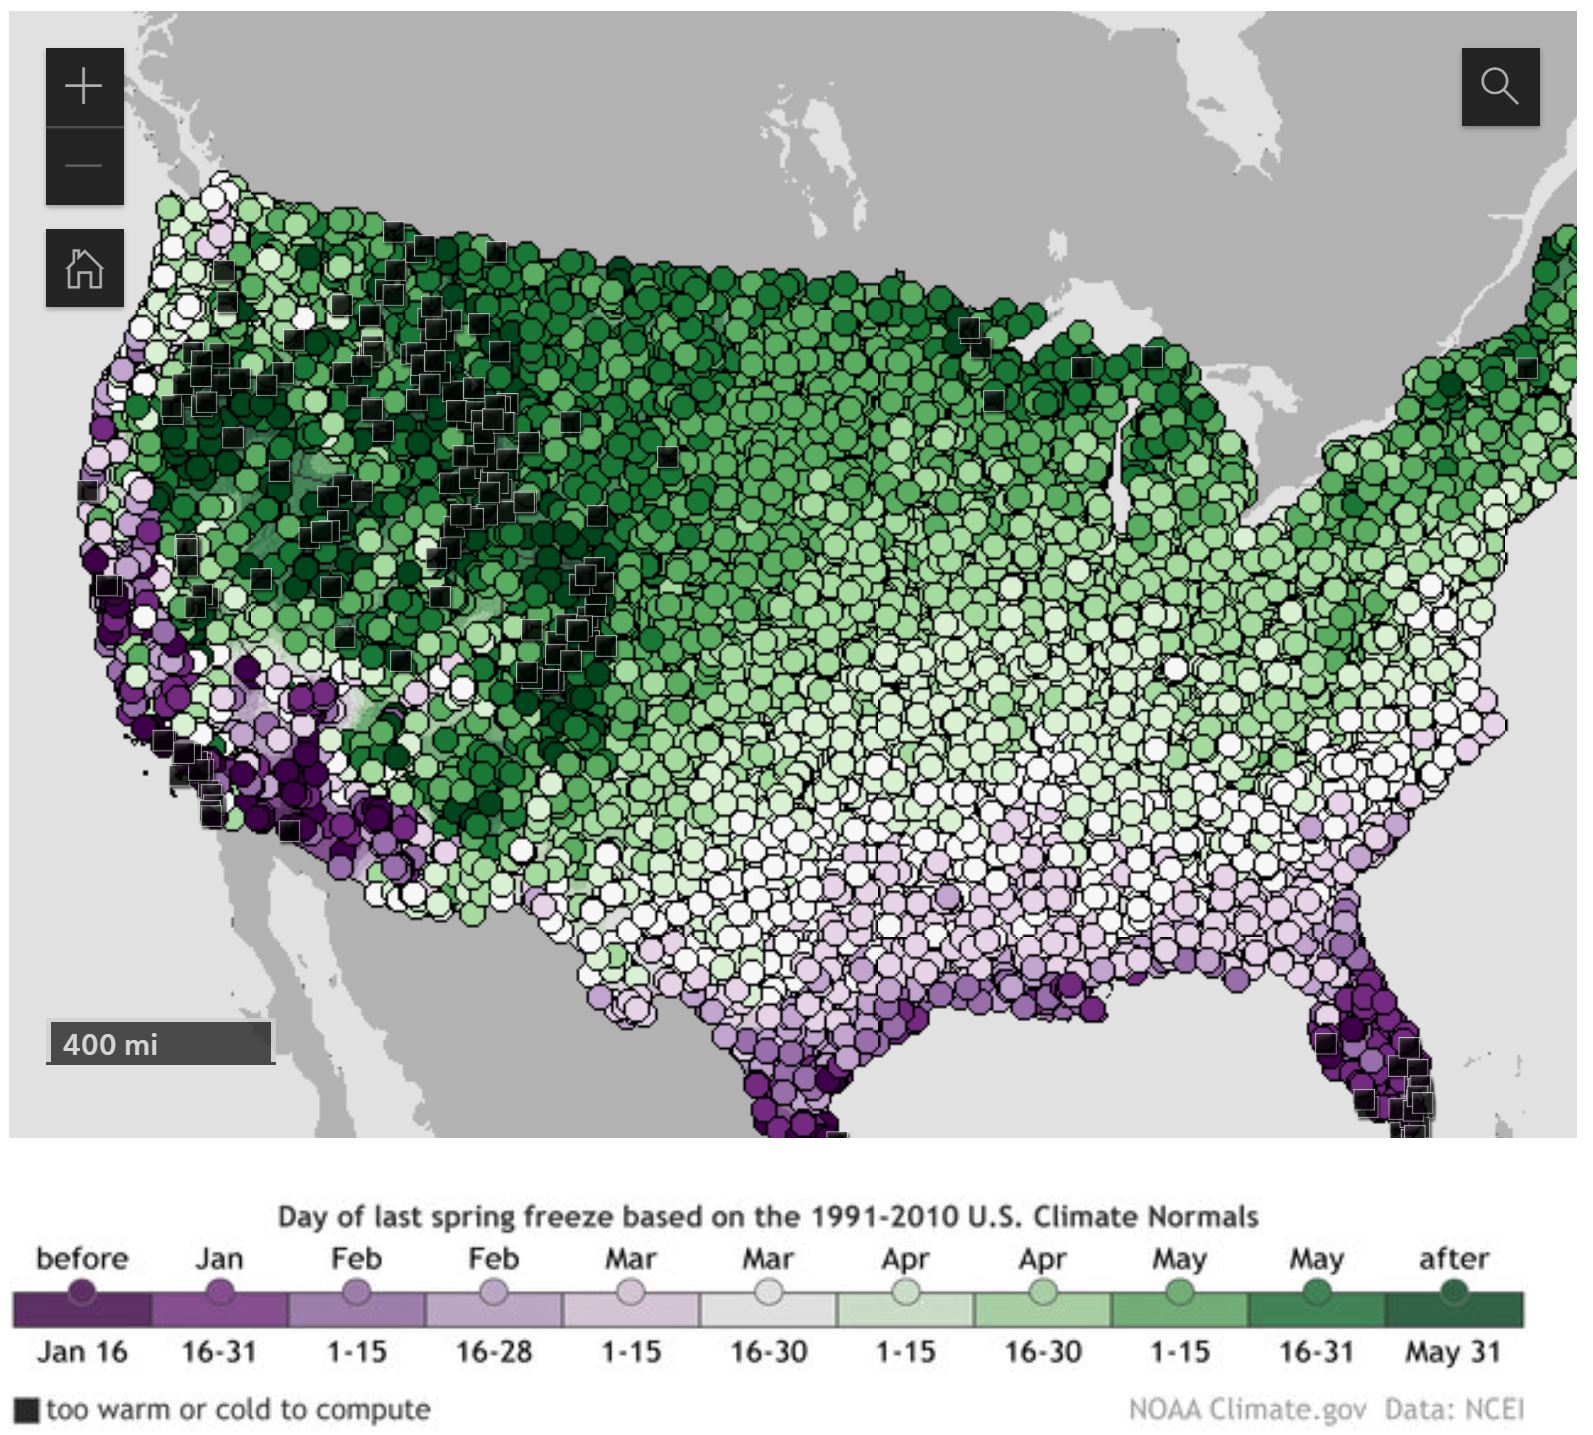
 Climate.gov has an interactive map in their article Interactive map: average date of last spring freeze across the United States by Rebecca Lindsey (3/21/2022). A picture of the map is posted here. You can zoom in on a location and click a dot to get and exact data for the day the chance of freeze drops below 50%.
Places where this milestone is reached before the first day of spring in mid-March appear in shades of purple, while places where it comes after that are colored in shades of green. Clearly, from the amount of green, the odds of freezing air temperature remain above 50 percent until after the solar start of spring in most of the Lower 48. As you’d expect, the farther north or higher in elevation you go, the later in the season (darker greens) this day generally arrives.
At the bottom of there is a link to Annual/Seasonal Normals and how to get data for this graph and for other cutoff percentages.