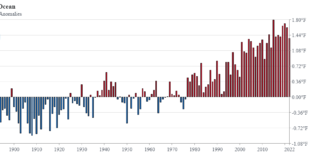
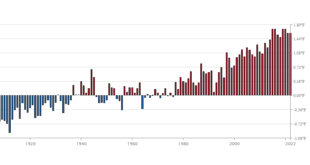
From NOAA’s November 2022 Global Climate Report: The November 2022 global surface temperature departure was the ninth highest for November in the 143-year record at 0.76°C (1.37°F) above the 20th century average of 12.9°C (55.2°F). Despite ranking among the ten warmest Novembers on record, this November was the coolest November …
Read More »How hot was Sept 2022?
From NOAA’s September 2022 Global Climate Report: The September 2022 global surface temperature departure tied September 2021 as the fifth highest for September in the 143-year record at 0.88°C (1.58°F) above the 20th century average of 15.0°C (59.0°F). The ten warmest Septembers on record have all occurred since 2012. September …
Read More »ENSO, Alaska, and correlation, what’s the connection?
The climate.gov article Moose tracks through Alaska and ENSO by Brian Brettschneider (6/23/2022) is a great example of using statistics in a real world setting; in this case the Pearson correlation. The graph copied here is interesting but the footnote may be even more so: This statistical analysis uses the …
Read More »How hot was April 2022?
From NOAA’s April 2022 Global Climate Report: The April 2022 global surface temperature was 0.85°C (1.53°F) above the 20th century average and tied with 2010 as the fifth highest for April in the 143-year record. The 10 warmest April months have occurred since 2010, with the years 2014–2022 all ranking …
Read More »Where do I get a wind rose?
The first question is probably what is a wind rose? Take a look at the graph to see an example of a wind rose. Now you probably want one for your location. Start at the Iowa State University IEM Site Information page. Select a network based on your state. Click …
Read More »Are we done with snow for the year?
If you check the Climate.gov page Interactive map: Latest snow on record for thousands of U.S. weather stations by Tom Di Liberto (updated 3/30/2022) you can find the date of the last snowfall on record at a weather station near you. On the map: This interactive map shows the latest …
Read More »When is your last freeze date?
Climate.gov has an interactive map in their article Interactive map: average date of last spring freeze across the United States by Rebecca Lindsey (3/21/2022). A picture of the map is posted here. You can zoom in on a location and click a dot to get and exact data for the …
Read More »Which way is the wind blowing?
Curious about current wind patterns around the globe? Check out Windy.com. This is one of those posts that I’m not sure how to use it in a math class, but the website is so cool I’m posting about it. The graph here is a still image but the wind currents …
Read More »Is there a polar vortex climate change connection?
The climate.gov article Understanding the Arctic polar vortex by Rebecca Lindsey (3/5/2021) is a complete primer on the polar vortex, jet stream, and what we know (and don’t) abut the connection to climate change. According to NOAA stratosphere expert Amy Butler, people often confuse the polar vortex with the polar jet stream, …
Read More »Where can we find regional weather data?
Go to the NOAA Climate at a Glance Divisional Mapping page. From the first drop down menu choose a state. Below that a state map appears and now click on a region. If time series data is desired click on the second tab along the top that says time series. …
Read More »
