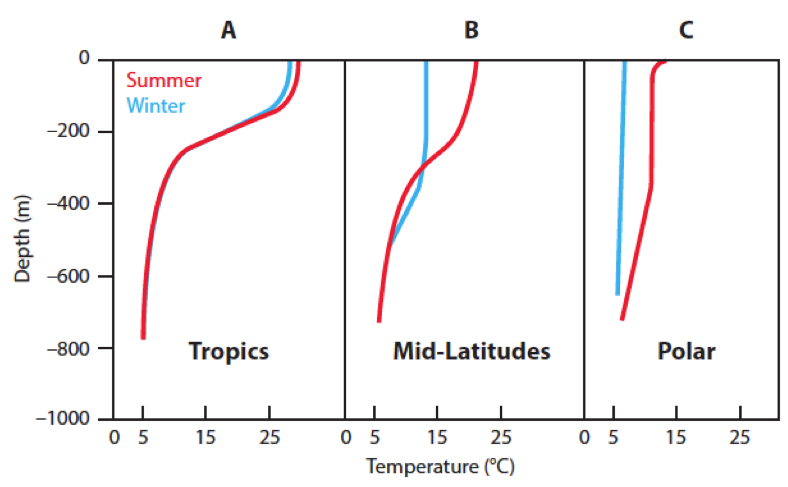
Exploring Our Fluid Earth has some educational materials for science. For example, the page Compare-Contrast-Connect: Seasonal Variation in Ocean Temperature Vertical Profiles includes the graph copied here. Some of these graph have inflection points which relate (I think) to thermoclines (transition between warmer surface water and colder deep water). There certainly seems to be a calculus connection here. For QL folks the graphs are a little tricky based on the y-axis and math folks would probably prefer the depth as the x-axis (why?). There are links on the right sidebar to other projects and information.
