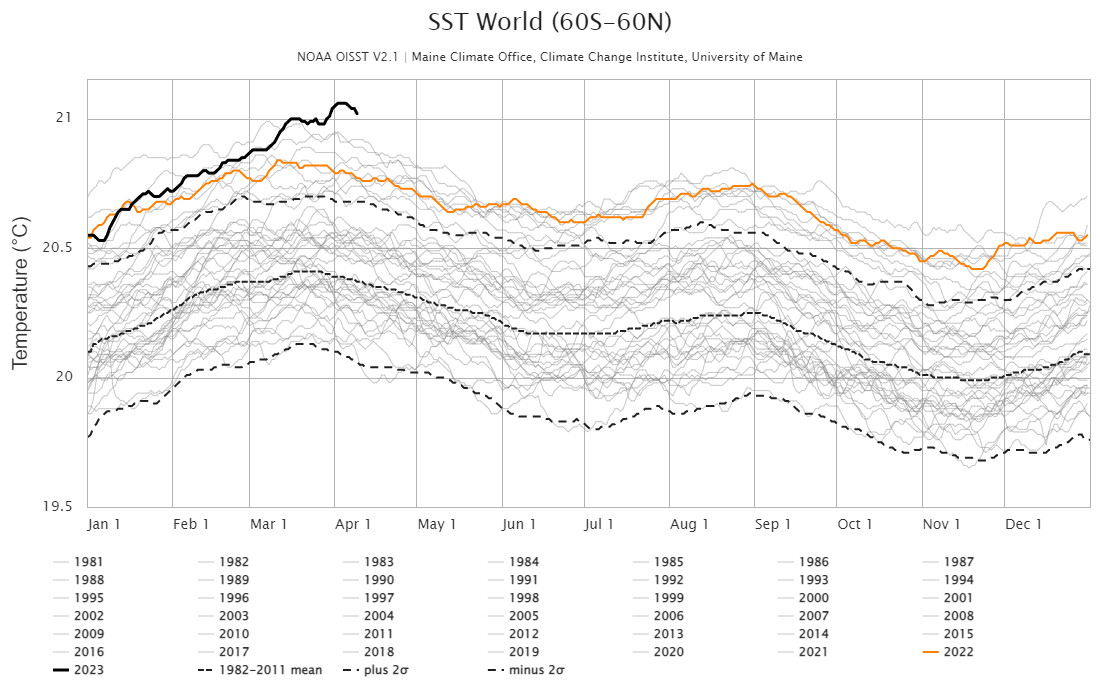
 Climate Reanalyzer has an interactive time series chart of ocean temperatures. The dark black line at the top is the current year and shall we say we are in uncharted waters. It would be nice if this graph was colored by ENSO status in the way NOAA has a global temperature graph by ENSO status. Why does this matter? According to a Guardian article:
La Niña periods – characterised by cooling in the central and eastern tropical Pacific and stronger trade winds – have a cooling influence on global temperatures. During El Niño periods, the ocean temperatures in those regions are warmer than usual and global temperatures are pushed up.
After a few years of La Niña we’ll see what El Niño will do to global temps.