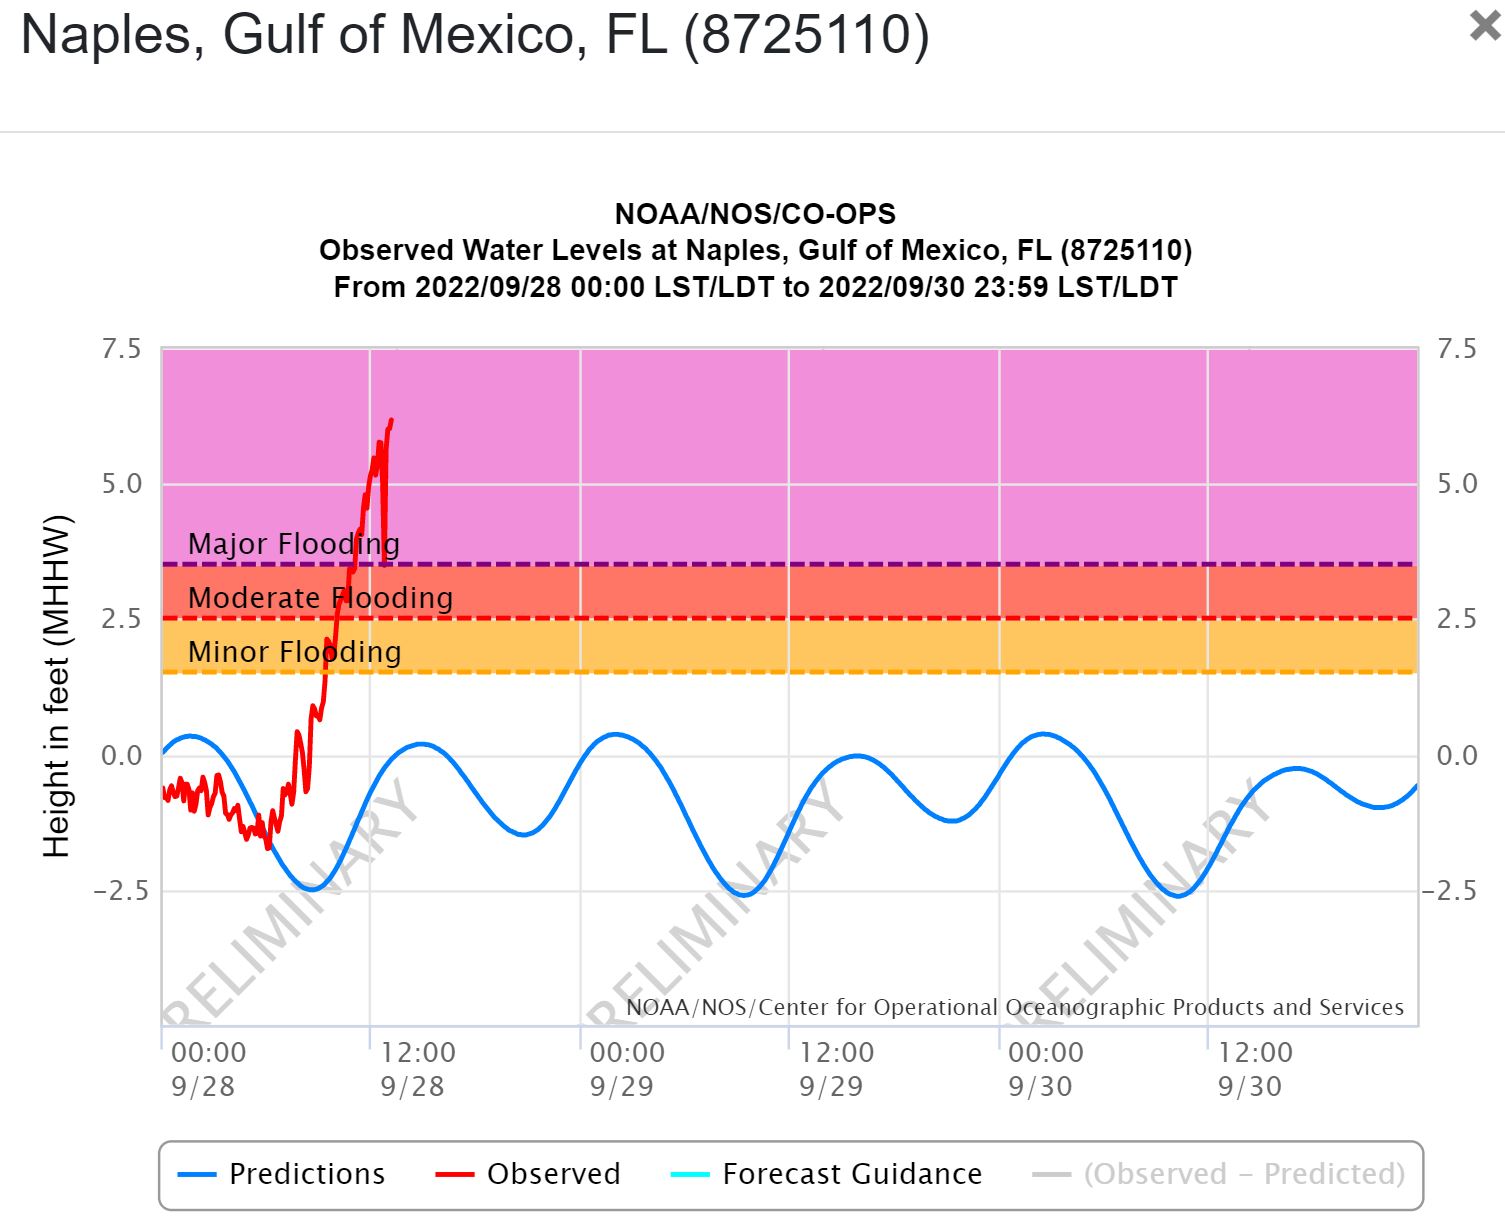
 If you go to NOAA’s Coastal Inundation Dashboard you can navigate the map and choose a station site. For example, here is the graph we get from selecting Naples FL.
If you’d like more information click on the Station Hope Page link at the bottom of the window that pops up when you select a station. From there use the top menu to select Station Info and then Data Inventory. On the next page select one of the categories by clicking on a bar. That will then take you to a page where you can select a date range and download the data by clicking the Data Only button on the bottom right.
Note that this is one location and others, even nearby, have different surges.
