Tag Archives: data source

What is the most recent PIP (poverty and inequity platform) update?

The World Bank article March 2023 global poverty update from the World Bank: the challenge of estimating poverty in the pandemic (3/29/2023) reports on poverty updates:

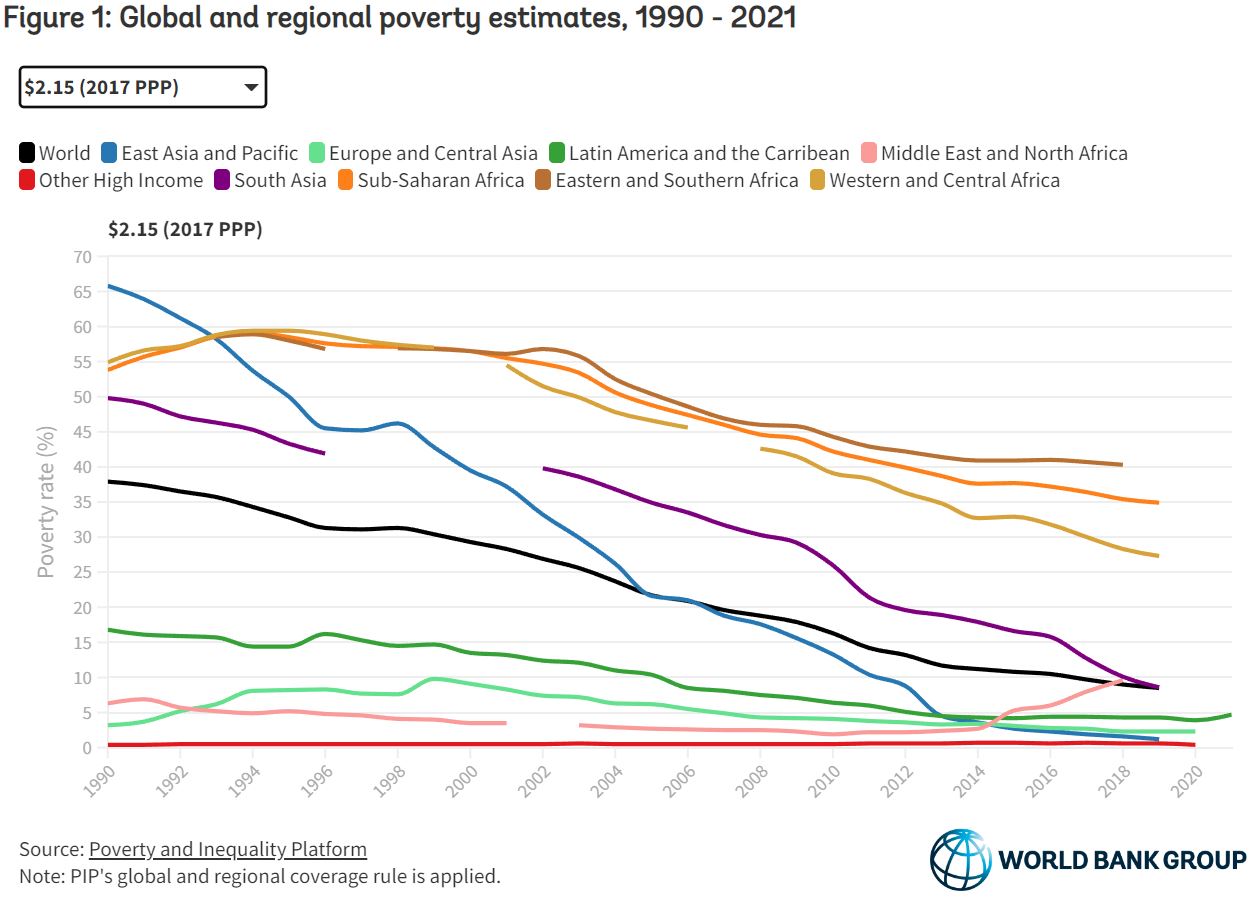
Global poverty estimates were updated today on the Poverty and Inequality Platform (PIP). This update includes new regional poverty aggregates in 2020 and 2021 for Latin America and the Caribbean, and in 2020 for Europe and Central Asia, and the group of advanced countries. These are the regions for which we now have sufficient survey data available during the COVID-19 pandemic. In total, 113 new country-years have been added, bringing the total number of surveys to more than 2,100.

The summary with calculus terms:

It is still the case that global poverty has been falling since the 1990s, and at a slower rate since 2014 (World Bank 2022). Extreme poverty has been falling in all regions, except the Middle East and North Africa due to conflict and fragility (World Bank 2020). Roughly 60% of the world’s extreme poor in 2019 lived in Sub-Saharan Africa alone, while 81% of the global poor at the poverty line of $3.6.

The PIP itself is a page worth exploring. It doesn’t look like much but if you start clicking you’ll find there is much to discover. Try the calculator on the bottom right of the graph or trying clicking a country.
How has electricity generation changed?

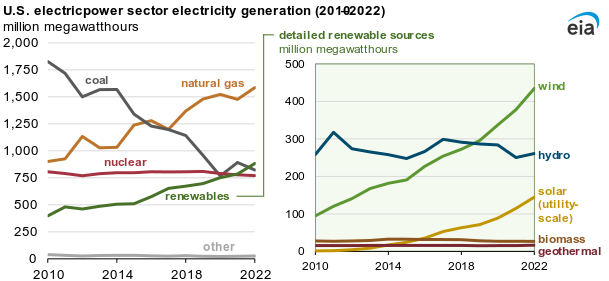
First some good news. The eia report Renewable generation surpassed coal and nuclear in the U.S. electric power sector in 2022 by Katherine Antonio (3/27/2023) notes

Last year, the U.S. electric power sector produced 4,090 million megawatthours (MWh) of electric power. In 2022, generation from renewable sources—wind, solar, hydro, biomass, and geothermal—surpassed coal-fired generation in the electric power sector for the first time. Renewable generation surpassed nuclear generation for the first time in 2021 and continued to provide more electricity than nuclear generation last year.

On the other hand, in 2021 solar, wind, hydro, and geothermal made up 18.5% of electricity generation and that moved to only 20.25% in 2022.  You can get his data from the electricity data browser from the eia. It is a great tool that provides graphs and downloads of the selected data.

What’s up with maternal mortality?

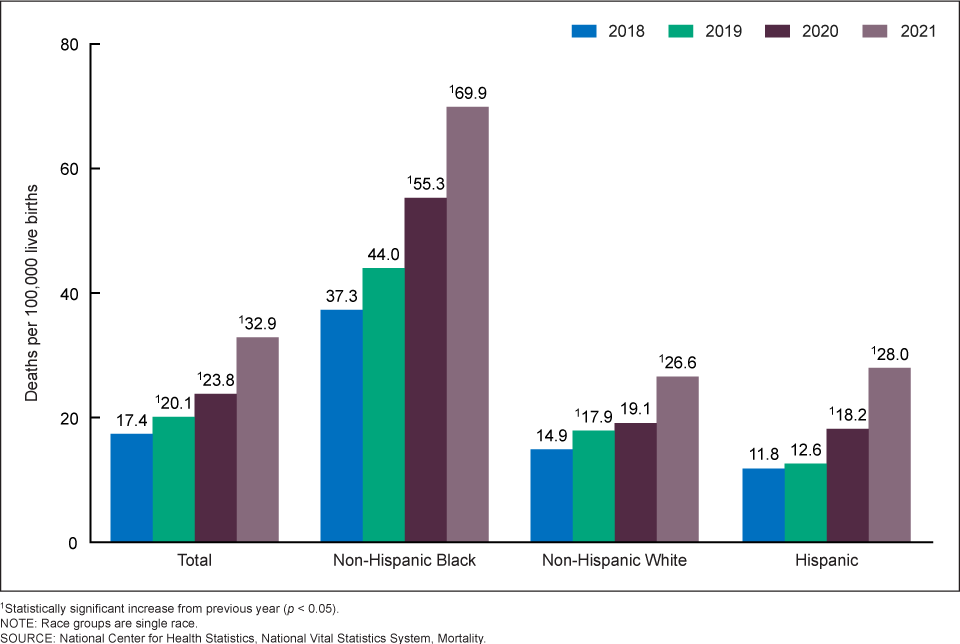
There has been some talk in the news about increasing maternal mortality in the U.S. This is due to the new CDC report Maternal Mortality Rates  in the United States, 2021 by Donna L. Hoyert (3/16/2023). The graph here is one from the report. Clearly the upward trend started before COVID and there is a racial difference. We should note that another graph shows upward trends by age group too.

Rates in 2021 were 20.4 deaths per 100,000 live births for women under age 25, 31.3 for those aged 25–39, and 138.5 for those aged 40 and over (Figure 2 and Table). The rate for women aged 40 and over was 6.8 times higher than the rate for women under age 25. Differences in the rates between age groups were statistically significant. The increases in the rates between 2020 and 2021 for each of these age groups were statistically significant.

The article includes a table of data and the number of births women 40+ have increased, which might explain some,  but not all, of the increase. Either way, the data is waiting for analysis is a statistics class.

As to the racial differences. In 2019 Kevin Drum reported on this in his post How Can We Reduce Black Maternal Mortality? He makes a case that the differences aren’t explained by racism; it is longish and worth reading.  A few quotes:

The differences in allostatic load are tiny—about the equivalent of one IQ point on an intelligence test—and Hispanics have a higher allostatic load than either blacks or whites but the lowest maternal mortality rate.

Poor blacks report less stress and higher levels of optimism than both poor whites and poor Hispanics. Put all this together and the toxic stress/weathering hypotheses look shaky.

What it seems to tell us is that there’s a difference in when black mothers die. Any pregnancy-related death within a year of delivery is counted as maternal mortality, and the difference in IHM rates suggests that in white hospitals black mothers die at high rates in the hospital, while in black hospitals they die at high rates after going home.


How are 35-44 year-olds doing?

There is a general narrative that younger generation are doing worse then older generations. When a narrative is “common knowledge” it is worth investigating if it is true or not. For the 35-44 year age range Kevin Drum has done just that in his post The (not kids anymore) are doing alright (3/2/2023). He has four graphs one of which is copied here. Some facts:

However, right now their unemployment rate is 2.6%, as low as it’s ever been.

Full-time workers are being paid more today than full-time workers of 20 years ago.

As with the full-time chart, annual earnings are higher now for 35-44 year-olds than they were 20 years ago.

This is not to say everything is perfect, but it does provide evidence that life isn’t that bad for the 35-44 cohort. The question then is why does this narrative exist?  The frustrating part here is this data is easily available at the BLS. Maybe journalist could take the time to look up a few facts before they make statements.


What is the new Antarctic sea ice minimum?

The Antarctic set a new record sea ice minimum at 1.788 million square kilometers beating out last years 1.924 million square kilometers. The graph here comes from the National Snow and Ice Data Center’s (NSIDC) Charctic Interactive Sea Ice Graph.  This is a great tool that allows the user to select Arctic or Antarctic, choose color schemes, and select the years to display. A link near the top right  corner of the graph allows users to download the data and the graph.

How hot was January 2023?

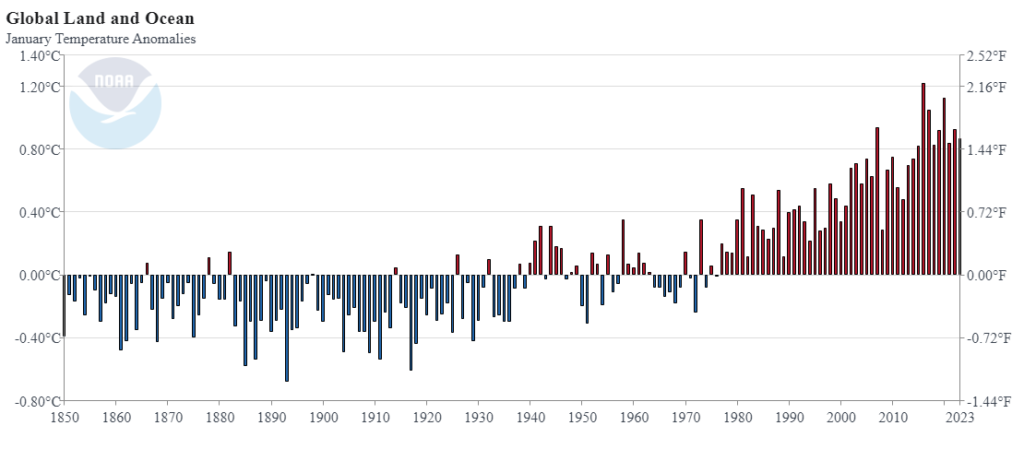
From NOAA’s January 2023 Global Climate Report:

January 2023 was the seventh-warmest January for the globe in NOAA’s 174-year record. The January global surface temperature was 1.57°F (0.87°C) above the 20th-century average of 53.6°F (12.0°C). January 2023 marked the 47th consecutive January and the 527th consecutive month with global temperatures, at least nominally, above the 20th-century average.

A few highlights:

This January, Europe had an unusually mild month that set a record for the warmest January on record. Europe’s surface temperature exceeded the previous January record set in 2007 by 0.16°C (0.28°F).

The Hawaiian region tied a 1941 record for its warmest January on record.

The contiguous U.S. had its sixth-warmest January on record. Seven states in the northeastern U.S.—New Hampshire, Vermont, Massachusetts, Rhode Island, Connecticut, New Jersey and Maine—had their warmest January on record.

Data is available at the top of the page.

What is the status of the Great Salt Lake?

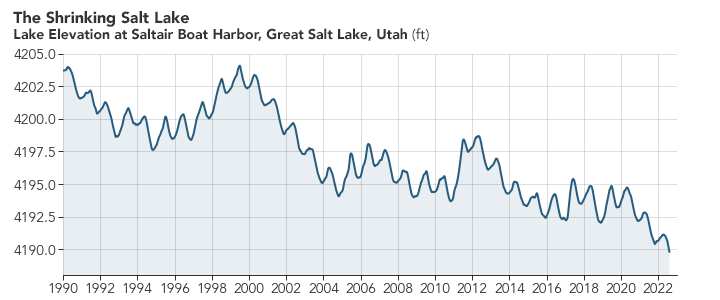
You may be seeing articles about the Great Salt Lake in the news and how it drying up is an environmental problem.  NASA Earth Observatory had a great article last summer, The Great Shrinking Lake, with maps and data about the loss of water.

Though water levels in the Great Salt Lake can fluctuate by year, they have generally been declining for decades. At the lake’s highest recorded level in 1986, mean water elevation reached as high as 4,211.6 feet (1,283.7 meters). Since 1986, the lake has dropped about 22 feet, hitting a new record low on July 3, 2022. By August 10, 2022, water levels had dropped slightly more—to 4,189.6 feet (1,276.9 meters).

Now 20 feet may not seem like a lot, but click the NASA link and take a look at the then and now map with the slider. The surface area of the lake had decreased dramatically. The NASA post also has a well-done animated graph. If you want data about the Great Salt Like go to Hydroshare page Collection of Great Salt Lake Data. Daily updated lake elevation and drought maps can be found at the Great Salt Lake Water Level page.

Has Lake Mead improved?

If you have been following my Lake Mead post you might be  curious if the rain in the west has improved the situation. Well, you probably looked at the graph by now and realized that the levels haven’t risen much. Based on the graph it seems that Dec to Jan is typically the biggest jump in levels with the max occurring each year between Jan and March. I’ll check back once the March data is in, but this certainly seems like a problem that is only getting worse.

The graph here is from the data on the Lake Mead at Hoover Dam, End of Month Elevation (feet) page by the Bureau of Reclamation. The Sept Lake Mead post.

How have commodity prices changes in the last month?

The World Bank has a monthly report that monitors commodity price movements, the pink sheet, highlighted in the post Energy prices dropped in January; non-energy inched up – Pink Sheet  by John Bafffes and Maria Hazel Macadangdang (2/8/2023).

Energy prices dropped 8.9% in January, led by natural gas in Europe (-44%) and coal (-16.1%), the World Bank’s Pink sheet reported. Non-energy prices gained 1.7%, led by metals.

The pink sheet linked to in the article has plenty of data. Quiz question: Which commodity had the largest percent change? See the third graph for the answer.