Tag Archives: statistics

Life Expectancy by Health Expenditure with Comments on Differences by Race

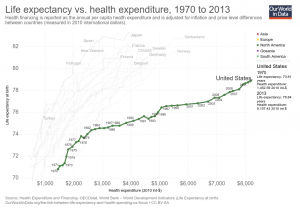
Our World in Data has an interactive graph of life expectancy by health expenditure for a number of countries, with downloadable data. The U.S. spends more money per person on health care, by far, than the other countries represented, without corresponding gains in life expectancy. At the same time, there are large differences in life expectancy by race in the U.S.  For example, the 2013 CDC National Vital Statistics Report life tables has life expectancy at birth for Non-Hispanic Black males of 71.9 years, which would be at the bottom of the chart.  Hispanic females are at the top in the U.S. with a life expectancy at birth of 84.2 years; a 12.3 year difference (data on page 3 here).  At the same time, the money spent on health care is also not likely to be equally distributed. The CDC is a source of life expectancy data and if you ask them they might have excel files. For an example of using life expectancy data, here is a 2012 paper Period Life Tables: A Resource for Quantitative Literacy published in Numeracy and freely available.

Life Expectancy vs Income Per Person

With health care in the news, let’s take a look at the knowledge that can be gained by using Gapminder. For example, the graph here is life expectancy vs income per person for 2015, with the bubbles representing population size of the country. Can you guess the bubble for the U.S.? Go to the graph on Gapminder to find out.  As a bonus their is a play button so that the graph will scroll from 1800 to 2015. You will also find a number of tools to change the graph and create others. All the data used by the Gapminder graphs is located on their data page.

Who eats more fast food the poor or wealthy?

Data helps us understand the world as it really is as opposed to what we think is true. The article Do poor people eat more junk food than wealthier American? uses the Bureau of Labor Statistics longitudinal data, accessible in the article, to answer the question.

Because it’s considered relatively inexpensive, there’s an assumption that poor people eat more fast food than other socioeconomic groups – which has convinced some local governments to try to limit their access.

Read the article to learn more and take advantage of the data sources for statistics or QL courses.

Fact Checking Coal Mining Jobs

The Washington Post’s Fact Checker article Pruitt’s claim that ‘almost 50,000 jobs’ have been gained in coal includes links to the Bureau of Labor Statistics data for each of their three screen shots of spreadsheets that back up their statements. The article notes:

In the last four months of the Obama administration, September to January, there was a gain of 1,400 jobs. In the first four months of the Trump administration, there has been a gain of 1,000 jobs.

While not part of the article, the graph here from the BLS is seasonally adjusted coal mining jobs since 1985.  Interestingly there was a drastic decline in coal mining jobs from 1985 until about 2000.

Is Life Fair or Not?

Stats classes are always looking for interesting data. One place to look in YouGov. For example, they did a poll (Note: it is not clear how the sample was obtained but they do provide a sample size.) asking people if life is fair.  Here are the results by gender.

  1. Do you think life is fair or not fair?
% TOTAL Male Female
Life is fair 38 46 31
Life is not fair 46 40 51
Not sure 16 14 18

You are set for a statistical test comparing Male vs Female perception of life being fair or not. This now allows for a discussion of why women would respond differently than men. One extra bonus on the site is you can look at the same questions broken down by other categories including income. Go to the YouGov Results page to see the data they have.

Data Spotlight: Employment and Wages by Race and Gender

The Economic Policy Institute has a State of Working America Data Library. Here you will find downloadable excel files on employment and wages by race and gender.  For example, you might be interested in the median hourly wages for men and women over time (see the graph – you can guess which is women and men). Not only is the data suitable for regression, but also for rich discussion on equality and policy.  This data set will get added to the statistics material pages.

Simplifying Statistics

These two videos present statistics about the U.S and World Population in the context of 100 people. The two videos provide opportunities for comparisons between the U.S. and the world that could be used in stats or QL class.

https://youtu.be/c2DN2jCefYk

Association Between State Same-Sex Marriage Policies and Adolescent Suicide Attempts

The Feb 20 article in JAM, Difference-in-Differences Analysis of the Association Between State Same-Sex Marriage Policies and Adolescent Suicide Attempts, provides some useful tables and graphs for a stats course. For example see table 2 (pictured here). From the paper:

Question  Are state same-sex marriage policies associated with a reduction in adolescent suicide attempts?

Findings  This difference-in-differences analysis of representative data from 47 states found that same-sex marriage policies were associated with a 7% reduction in the proportion of all high school students reporting a suicide attempt within the past year. The effect was concentrated among adolescents who were sexual minorities.

Meaning  Same-sex marriage policies are associated with reduced adolescent suicide attempts.