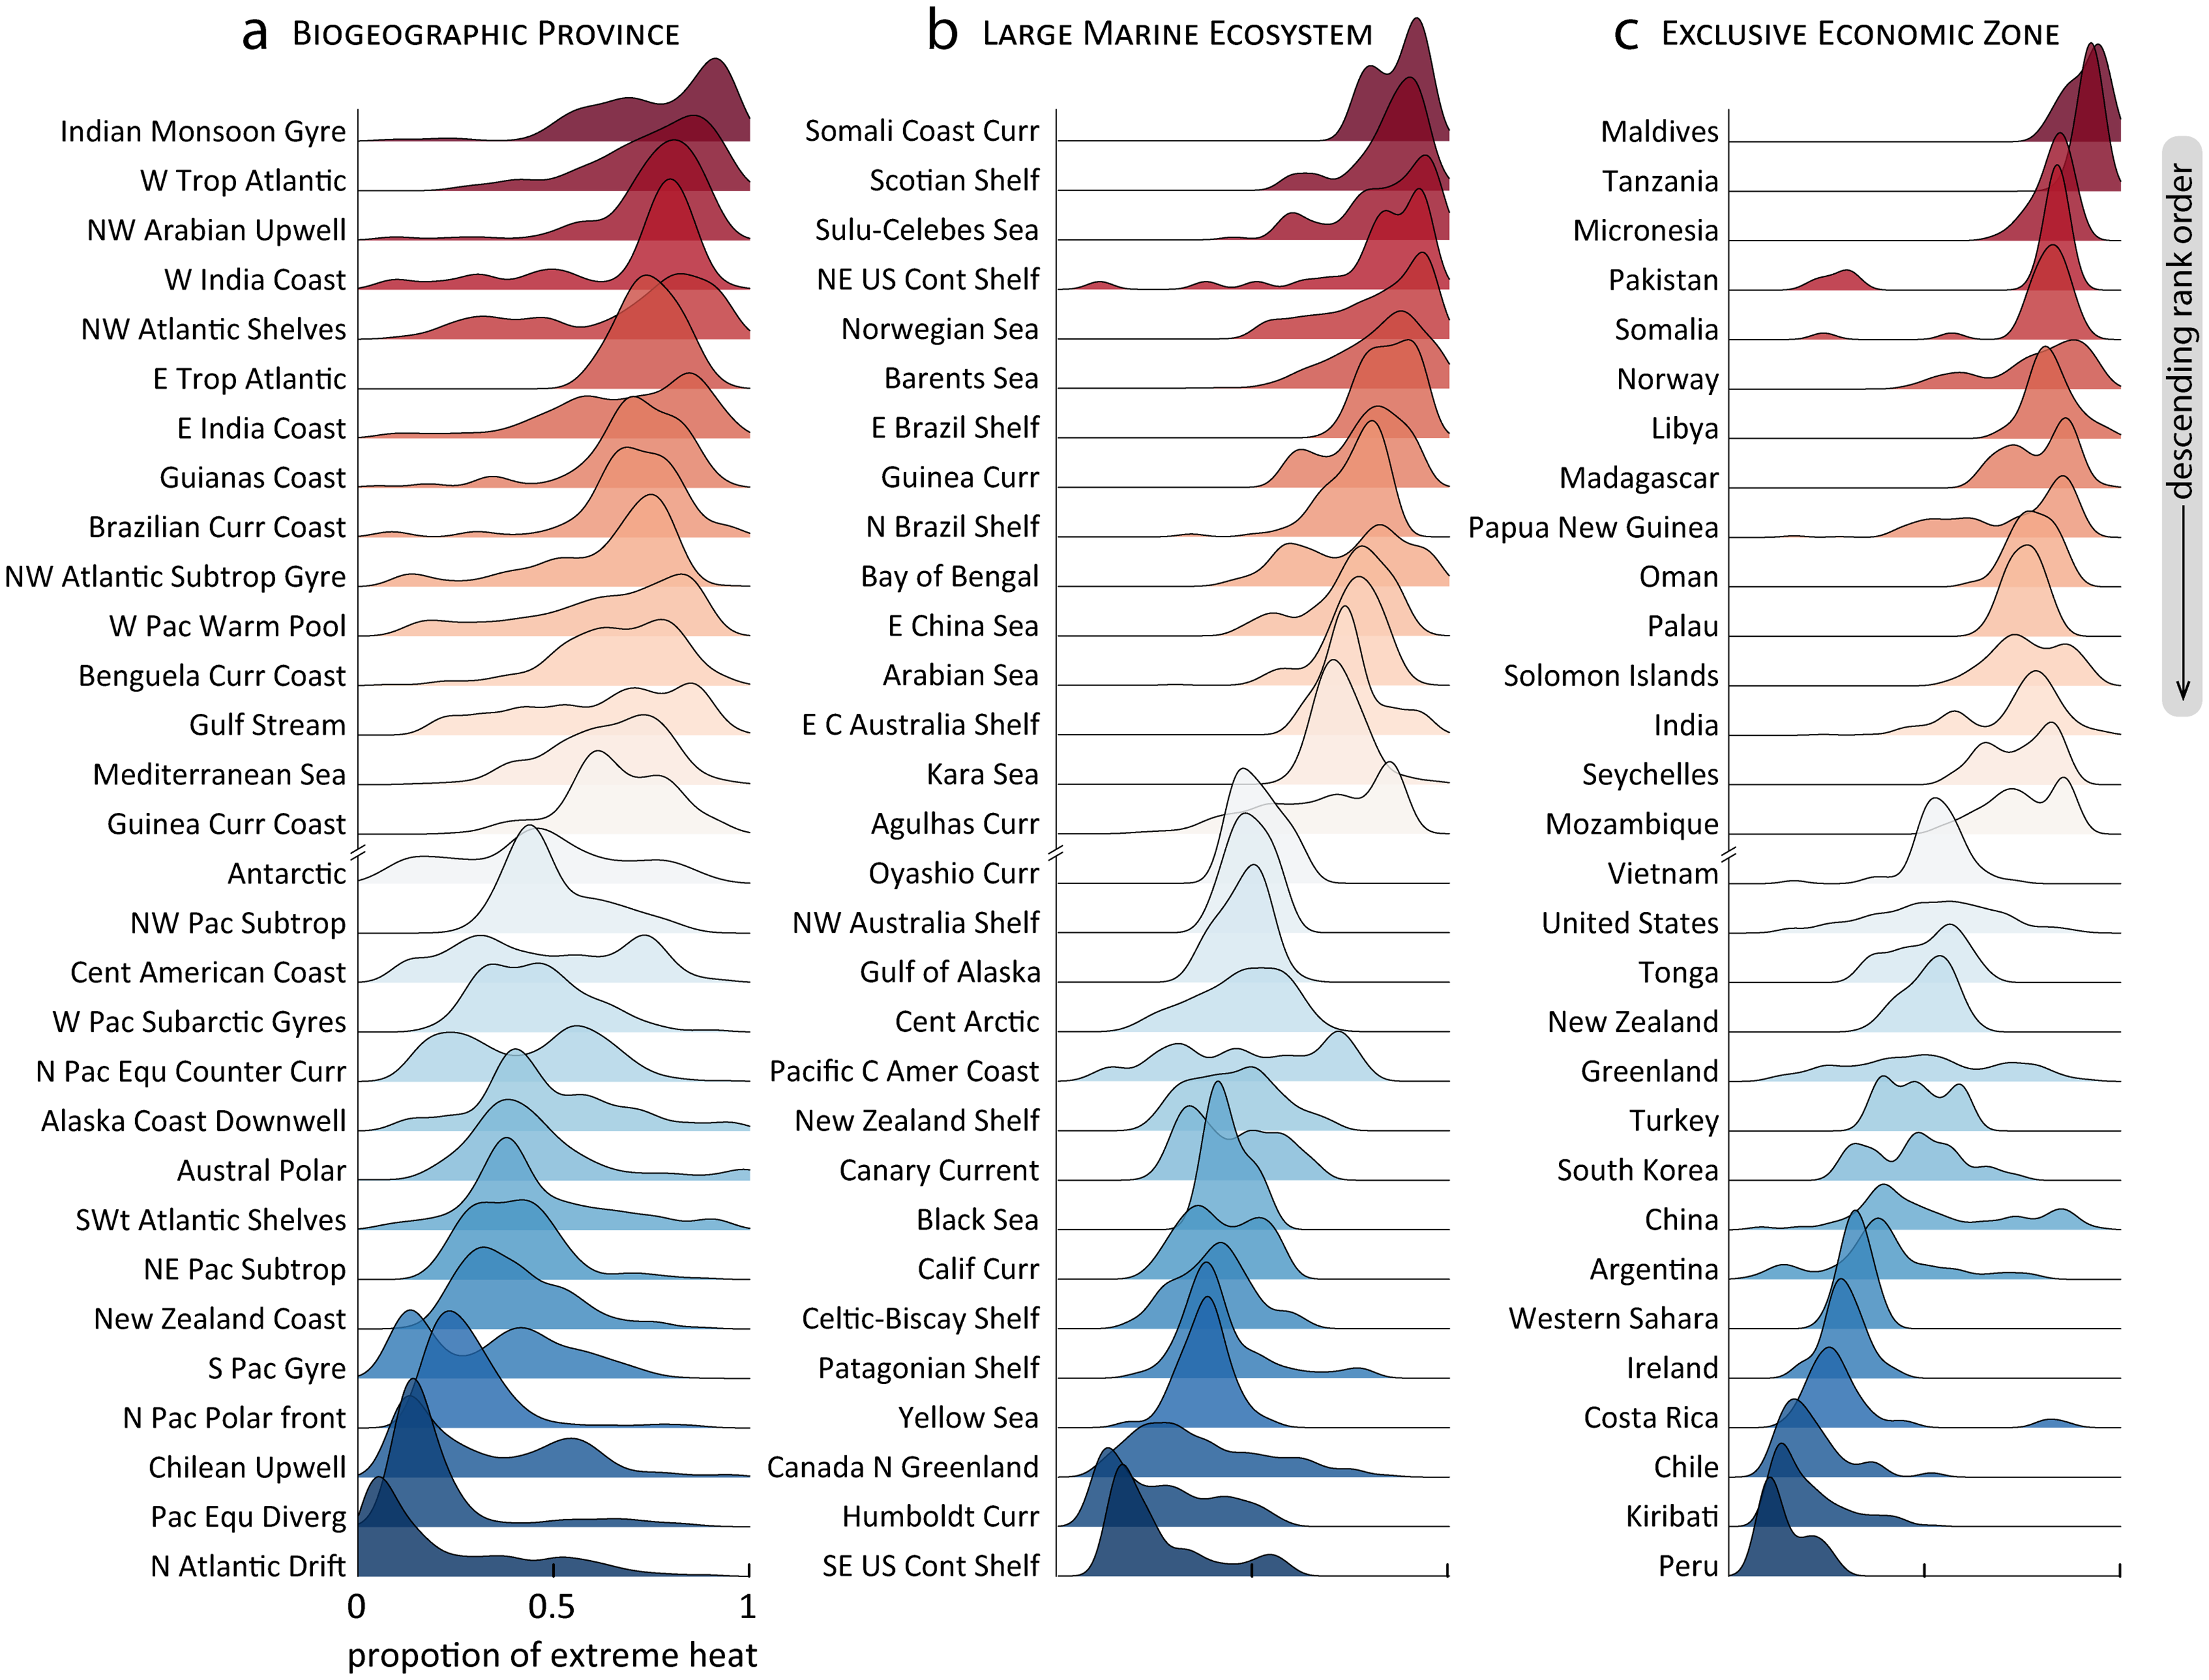
The climate.gov article Can we detect a change in Atlantic hurricanes today due to human-caused climate change? by Chris Landsea and Tom Knutson (5/11/2022) is a great example of the challenges in understanding complex systems. If all you want is the answer:
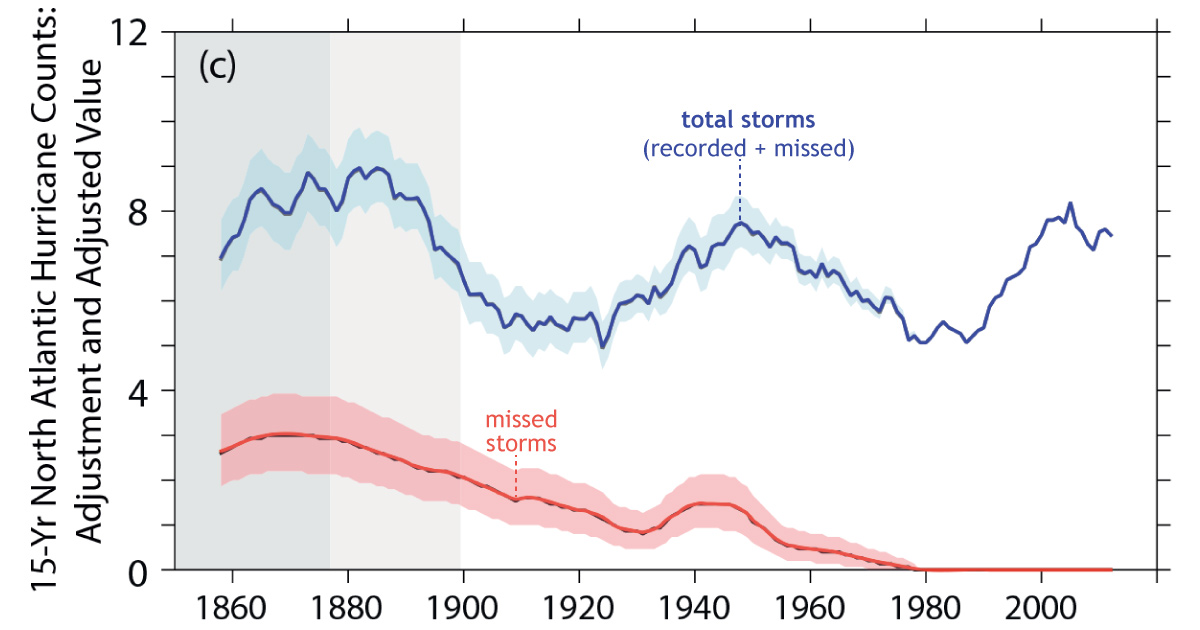
Atlantic hurricanes display distinct busy and quiet periods: Busy hurricane decades occurred in the late 19th century, mid-20th century, and from the mid-1990s onward, but quieter decades in the early 20th century and in the 1970s to early-1990s.
These multi-decadal variations in Atlantic tropical storms and hurricanes have been linked to a phenomenon called the Atlantic Multidecadal Variability, which may be primarily natural internal variability or aerosol-driven.
A detectable greenhouse gas-induced influence on observed Atlantic tropical storm and hurricane behavior to date is difficult to identify because of the 50-80 year variability in hurricane activity.
The bottom-line answer to the question in the title is: No, we cannot confidently detect a trend today in observed Atlantic hurricane activity due to man-made (greenhouse gas-driven) climate change. Some human influence may be present though still below the threshold for confident detection.
There is a difference between more hurricanes and worse hurricanes.
Finally, a number of studies have found that several Atlantic hurricane metrics, including hurricane maximum intensities, hurricane numbers, major hurricane numbers, and Accumulated Cyclone Energy have all increased since around 1980.
However, in a 2019 tropical cyclone-climate change assessment, the majority of authors concluded that the recent hurricane activity increases mentioned above did not qualify as a detectable man-made influences (meaning clearly distinguishable from natural variability). Another hurricane metric, the fraction of rapidly intensifying Atlantic hurricanes, was reported to have increased since around 1980 (Bhatia et al. 2019), and they found that this change was highly unusual compared with simulated natural variability from a climate model, while being consistent in sign with the expected change from human-caused forcing. Even so, however, their confidence was limited by uncertainty in how well the single climate model used was representing real-world natural variability in the Atlantic region.
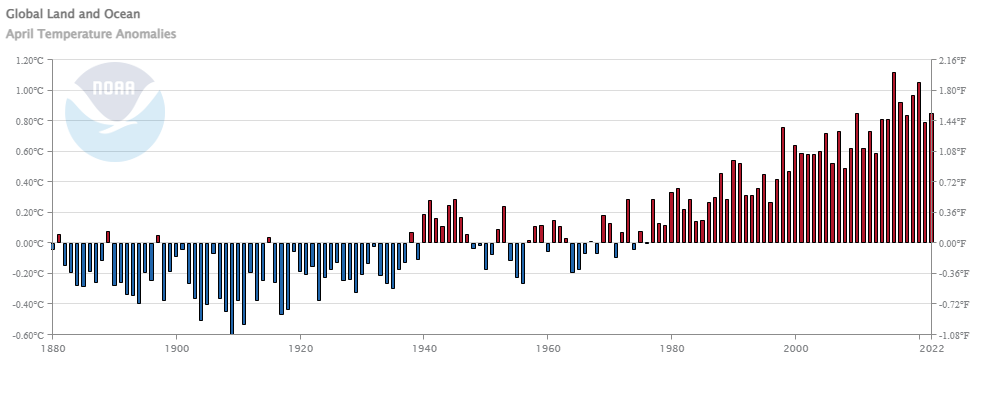
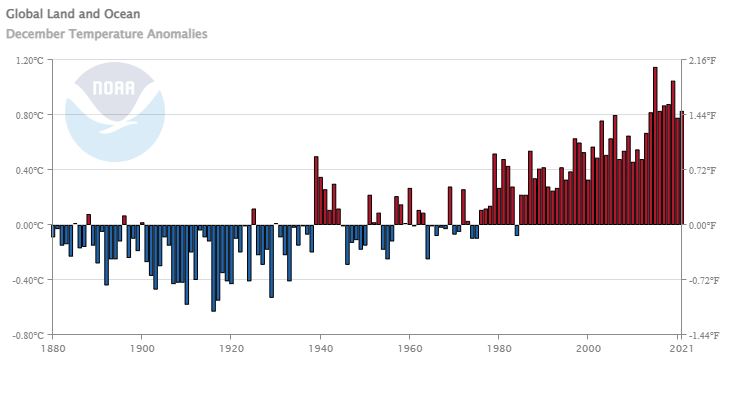
 From NOAA’s June 2022 Global Climate Report:
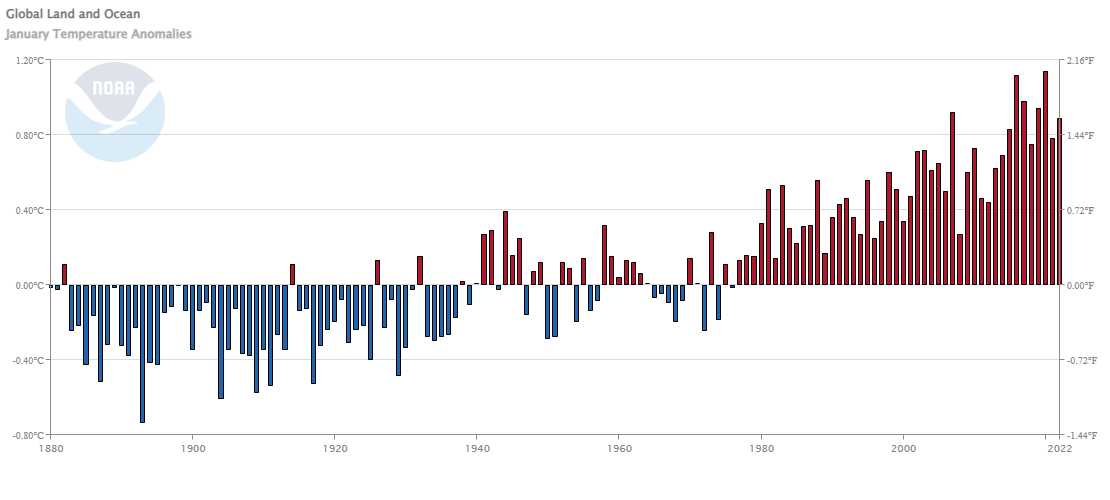
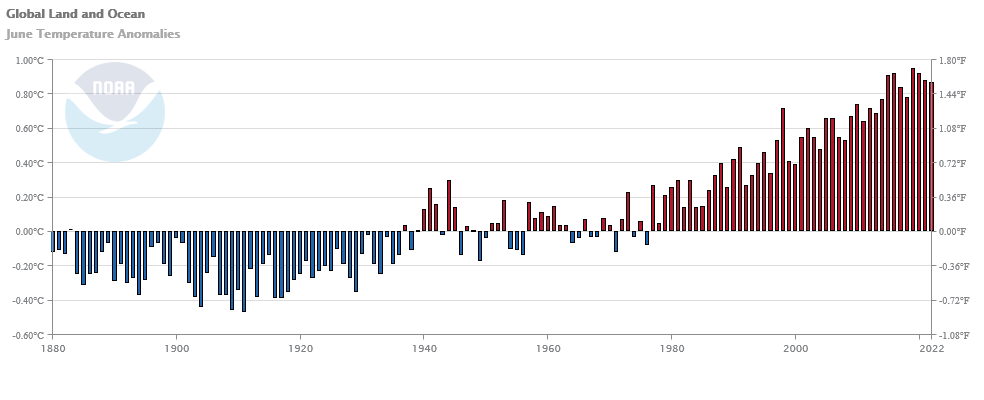