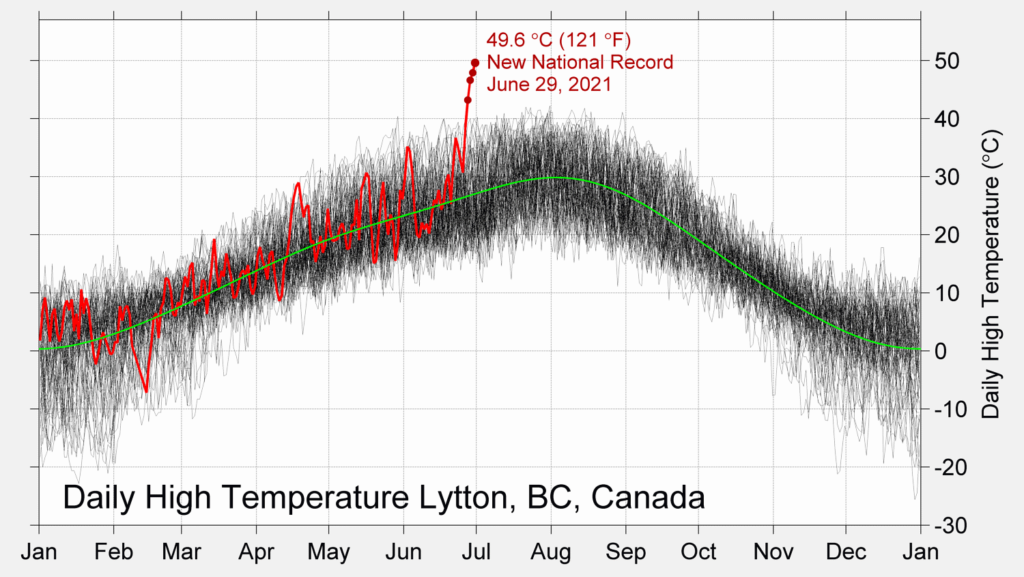
Berkeley Earth summarizes the recent heatwave in the Pacific Northwest in the article The Pacific Northwest Heatwave in Context (7/6/2021). The graph by Dr. Robert Rohde copied here is striking and really says all that needs to be said. This is a graph that everyone should have to study and understand. This was anything but a typical heatwave.
There are other graphs and links to dedicated data pages for Washington State, Oregon, Seattle, Portland, Vancouver, and Canada. On these pages there are more graphs and links to the data that created the graphs.

