Which regions use the most AC?

From the eia article Nearly 90% of U.S. household used air conditioning in 2020 by Ross Beall and Bill McNary (5/31/2022):

In 2020, the Midwest Census Region and South Census Region had the highest percentages of households using AC, at 92% and 93%, respectively. The lowest percentage of households using AC was 73% in the West Census Region; this census region includes households in several climate areas, such as the marine climate region along the Pacific Coast, where residential AC use was 49%.

The article cites the Residential Energy Consumption Survey, which is a nice data source.

Have we passed peak agricultural land?

The chart here is from the Our World in Data article After millennia of agricultural expansion, the world has passed ‘peak agricultural land’ by Hannah Ritchie (5/30/2022).  Interestingly

Despite this reduction in agricultural land, the world has continued to produce more food. This is true of both crops and livestock.

We see this decoupling in the chart that presents the UN FAO’s data. It shows that global agricultural land – the green line – has peaked while agricultural production – the brown line – has continued to increase strongly, even after this peak.

When we break each agricultural component out individually, or look at it in physical rather than monetary units, we find the same trend: a continued increase in output. You can explore this data for any crop or animal product in our Global Food Explorer.

We should note:

The third, as I mentioned earlier, is that global croplands are still expanding. We see this in the chart. Other sources suggest that this rate of increase might be even faster. The World Resources Institute looks at this research in more detail here.

The article has three graphs and the data for each can be downloaded.


Is there a relationship between homicide and race?

One more post from the Manhattan Institute’s* Breaking Down the 2020 Homicide Spike by Christos A. Makridis and Robert VerBruggen (5/18/2022). We first note:

Homicides went up throughout the country, and for every major demographic group, in 2020, but they did not rise for everyone equally, as is clear when we break down the numbers by race, age, sex, urbanicity, and region of the country.

Related to figure 3 (copied here) we have this, which is excellent  QL material:

The racial and ethnic breakdown is perhaps most striking in this regard. Proportionally, homicide rates rose by about 34% for black Americans and about 19% percent for non-Hispanic whites: a notable, but not extreme, gap (Figure 3). But since the black homicide rate was already many times higher than the white one, this translated into 8 additional black deaths for every 100,000 population—an increase similar to the total homicide rate for the country as a whole—while the death rate for whites rose by only 0.5 per 100,000. (Recall that these numbers pertain to the homicide victims, not the killers, though American homicide is overwhelmingly intraracial.)

There is a lot to discuss in this article as well as ample quantitative literacy material. There is a discussion of methods and the CDC data they use is easy enough to locate.

* (This is the same note from Monday’s Post) Yes, MI has a clear political leaning but that doesn’t make their work incorrect. Their data and methods are sound here and this should be engaged not ignored. If someone thinks something is incorrect then let me know.


Is there a correlation between Homicide rate and voting?

The Manhattan Institute* has a lengthy report on the increasing homicide rate, Breaking Down the 2020 Homicide Spike by Christos A. Makridis and Robert VerBruggen (5/18/2022), with numerous interesting charts. From the report (figure 7 copied here):

Next, we explore the correlation between two geographic factors—population and GOP vote share—and the growth rate in the homicide rate per capita between 2019 and 2020. Each observation is a county whose size is determined by its population, giving larger counties greater weight. Counties with a higher share of GOP voters not only have lower homicide rates but also a lower growth in homicide rates between 2019 and 2020 (Figures 6 and 7).

There is a positive correlation between population in a county and the growth in the homicide rate, but the correlation between population and just the homicide rate is slightly negative (Figure 8). In this sense, even though there are slightly higher rates of homicide deaths per capita in smaller counties, some of those differences could be driven by spurious factors that are correlated with population.

There is a lot to discuss in this article as well as ample quantitative literacy material. There is a discussion of methods and the CDC data they use is easy enough to locate.

* Yes, MI has a clear political leaning but that doesn’t make their work incorrect. Their data and methods are sound here and this should be engaged not ignored. If someone thinks something is incorrect then let me know.


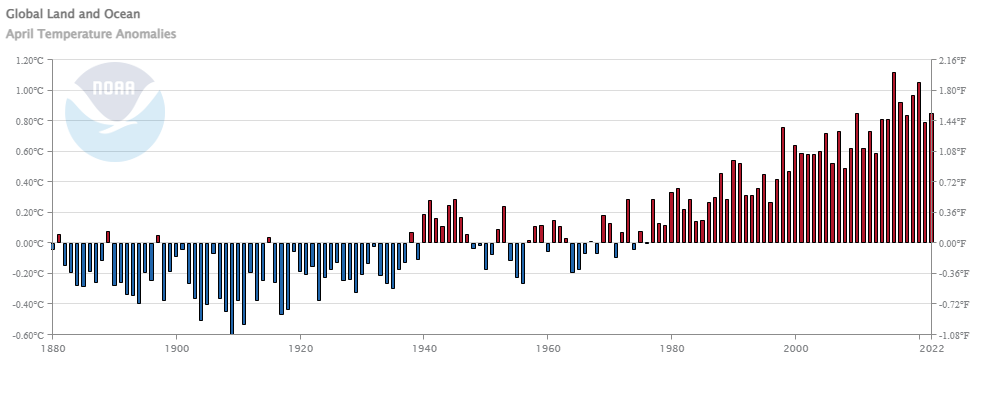
How hot was April 2022?

From NOAA’s April 2022 Global Climate Report:

The April 2022 global surface temperature was 0.85°C (1.53°F) above the 20th century average and tied with 2010 as the fifth highest for April in the 143-year record. The 10 warmest April months have occurred since 2010, with the years 2014–2022 all ranking among the 10 warmest Aprils on record. This marked the 46th consecutive April and the 448th consecutive month with temperatures, at least nominally, above the 20th century average.

Time series data available at a link at the top of the page.

Are there more hurricanes due to climate change?

The climate.gov article Can we detect a change in Atlantic hurricanes today due to human-caused climate change? by Chris Landsea and Tom Knutson (5/11/2022) is a great example of the challenges in understanding complex systems. If all you want is the answer:

Atlantic hurricanes display distinct busy and quiet periods:  Busy hurricane decades occurred in the late 19th century, mid-20th century, and from the mid-1990s onward, but quieter decades in the early 20th century and in the 1970s to early-1990s.

These multi-decadal variations in Atlantic tropical storms and hurricanes have been linked to a phenomenon called the Atlantic Multidecadal Variability, which may be primarily natural internal variability or aerosol-driven.

A detectable greenhouse gas-induced influence on observed Atlantic tropical storm and hurricane behavior to date is difficult to identify because of the 50-80 year variability in hurricane activity.

The bottom-line answer to the question in the title is: No, we cannot confidently detect a trend today in observed Atlantic hurricane activity due to man-made (greenhouse gas-driven) climate change. Some human influence may be present though still below the threshold for confident detection.

There is a difference between more hurricanes and worse hurricanes.

Finally, a number of studies have found that several Atlantic hurricane metrics, including hurricane maximum intensities, hurricane numbers, major hurricane numbers, and Accumulated Cyclone Energy have all increased since around 1980.

However, in a 2019 tropical cyclone-climate change assessment, the majority of authors concluded that the recent hurricane activity increases mentioned above did not qualify as a detectable man-made influences (meaning clearly distinguishable from natural variability). Another hurricane metric, the fraction of rapidly intensifying Atlantic hurricanes, was reported to have increased since around 1980 (Bhatia et al. 2019), and they found that this change was highly unusual compared with simulated natural variability from a climate model, while being consistent in sign with the expected change from human-caused forcing. Even so, however, their confidence was limited by uncertainty in how well the single climate model used was representing real-world natural variability in the Atlantic region.


How much do corporation pay in local taxes?

We tend to think of corporate taxes as a federal issues and less a local issue, but the article Reclaiming corporate tax revenues by Josh Bivens (4/14/2022) in EPI has some key takeaways:

Depending on how it is measured, the effective state and local tax rate on corporate profits shrunk by between a third and a half between 1989 and 2017.

The resulting revenue shortfall is estimated to be at least $43 billion and possibly as high as $57 billion.

The erosion of state corporate income tax revenue has nothing to do with corporations’ ability to pay. Indeed, corporate profits have risen even as corporate tax revenues have declined.

This has real consequences for state and local spending—constraining these governments’ ability to provide basic services to their residents.

State and local (S&L) public investment is more than the Fed:

For most years since 1979—and for all years since 1988—the S&L sector has directed more public investment than the federal government. By 2019 this gap was quite large, with public investment from the S&L sector equaling 2.0% of GDP while investment from the federal government totaled just 0.8% of GDP. In dollar terms, that’s a gap of roughly $220 billion annually.

The article is detailed with numerous charts (and data). Worth reading.


How old is Arctic sea ice?

The NSIDC page Springtime in the Artic (5/3/2022) has a section on sea ice age.

At the end of last summer, the extent of the oldest ice (greater than 4 years old) tied with 2012 for the lowest in the satellite record. This spring, we continue to see a dominance of first-year ice (Figure 4). The percentage of the greater than 4-year-old ice, which once comprised over 30 percent of the Arctic Ocean, now makes up only 3.1 percent of the ice cover.

The page has other graphs and maps related to ice. There is a link in the citations for data related to the graph copied here.


Where do I get a wind rose?

The first question is probably what is a wind rose? Take a look at the graph to see an example of a wind rose. Now you probably want one for your location.  Start at the Iowa State University IEM Site Information page. Select a network based on your state. Click switch network to change the map. You can then select a station by double clicking a dot or using the drop down menu. Once you click select a station you get a new page.  Click the Wind Roses tab to get a selection of wind roses. You’ll get a total data one and ones for each month of the year.  Each wind rose graph has a link to view the raw data, which can be downloaded. You can also generate a custom wind rose by clicking the Custom Wind Roses tab. Climate.gov has some information about the wind roses at Wind Roses from airports around the world – Graphics or Raw Data Tables.

What should get you into college?

The Pew article, U.S. public continues to view grades, test scores as top factors in college admissions by Vianney Gómez (4/26/2022), provides the result of a survey about college admissions:

More than nine-in-ten Americans (93%) say high school grades should be at least a minor factor in admissions decisions, including 61% who say they should be a major factor. Grades are, by far, the criteria the public says should most factor into admissions decisions. This is followed by standardized test scores (39% major factor, 46% minor factor) and community service involvement (19% major, 48% minor), according to a Pew Research Center survey conducted March 7-13, 2022.

By comparison, nearly three-quarters of Americans or more say gender, race or ethnicity, or whether a relative attended the school should not factor into admissions decisions.

There are three graphs in the article, such as the one copied here, and a methodology section.