 Here is an excerpt from my Briefed by Data post Minerals for renewables:
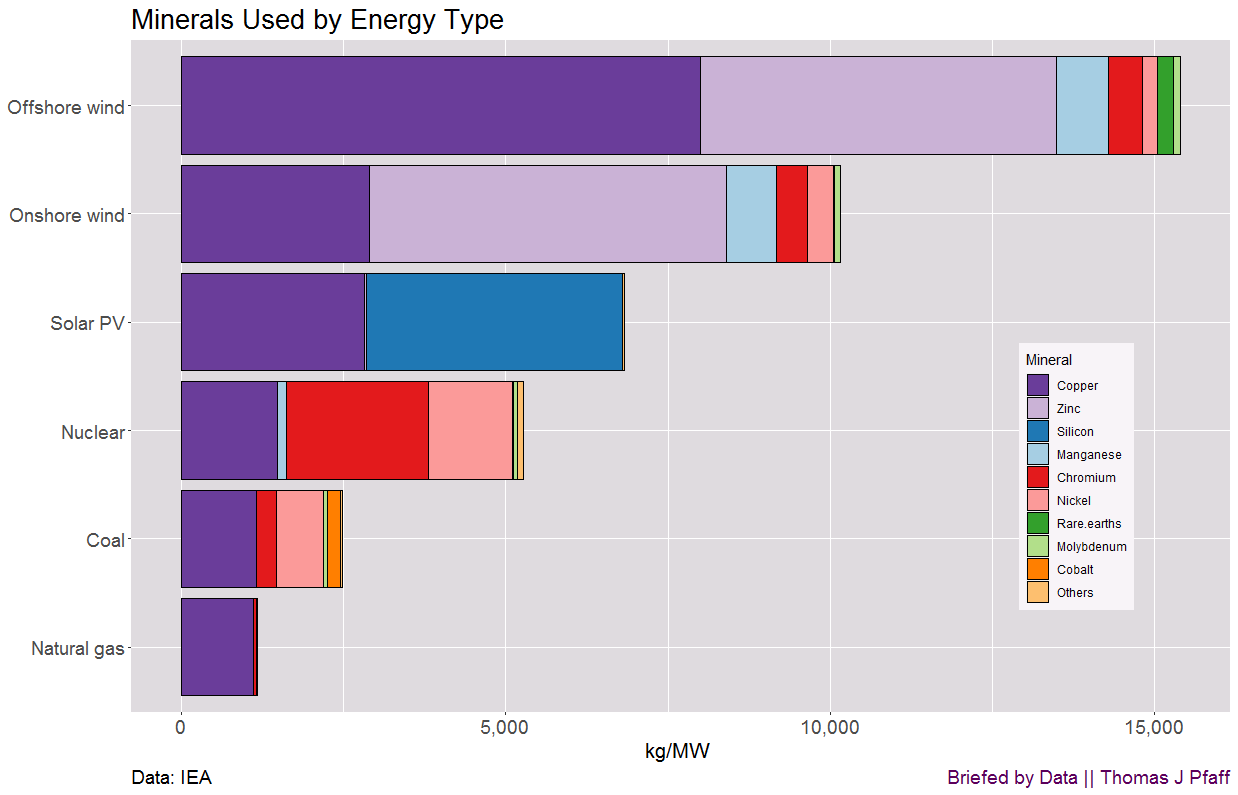
A few things stand out. The first is the amount of minerals utilized for offshore wind, which is 50% more than for the next category, onshore wind. The second factor is the importance of copper in all energy sources. Figure 2 shows the copper price from FRED. Prior to 2004, the price remained below 3,000 per metric ton, and it has climbed around four to five times since then.
The post includes links to the IEA data plus other graphs. If you aren’t getting the Briefed by Data newsletter in your inbox then consider subscribing when you read the post.