 From the eia article As solar capacity grows, duck curves are getting deeper in California (June 21, 2023):
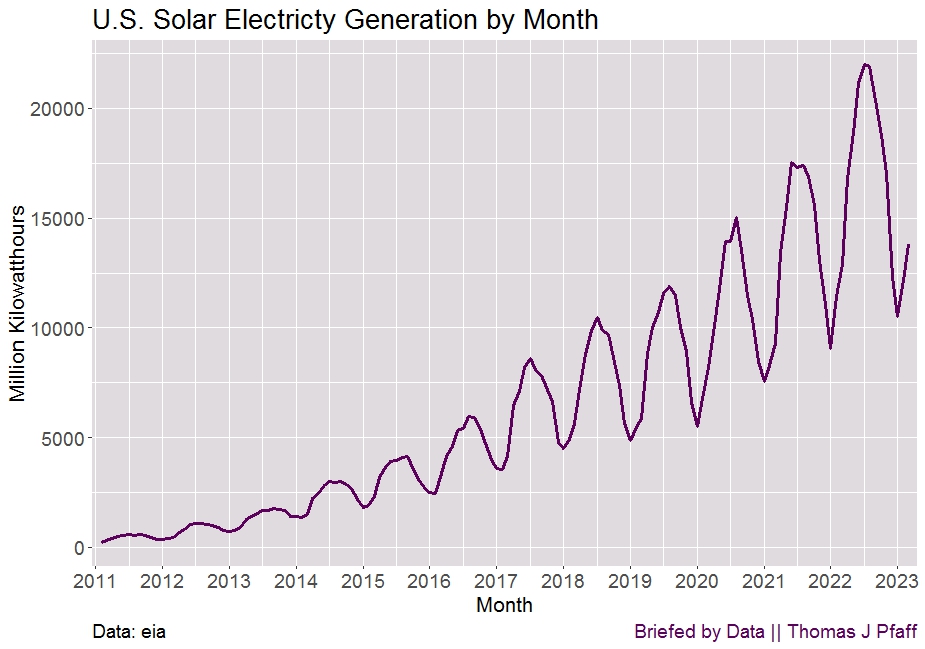
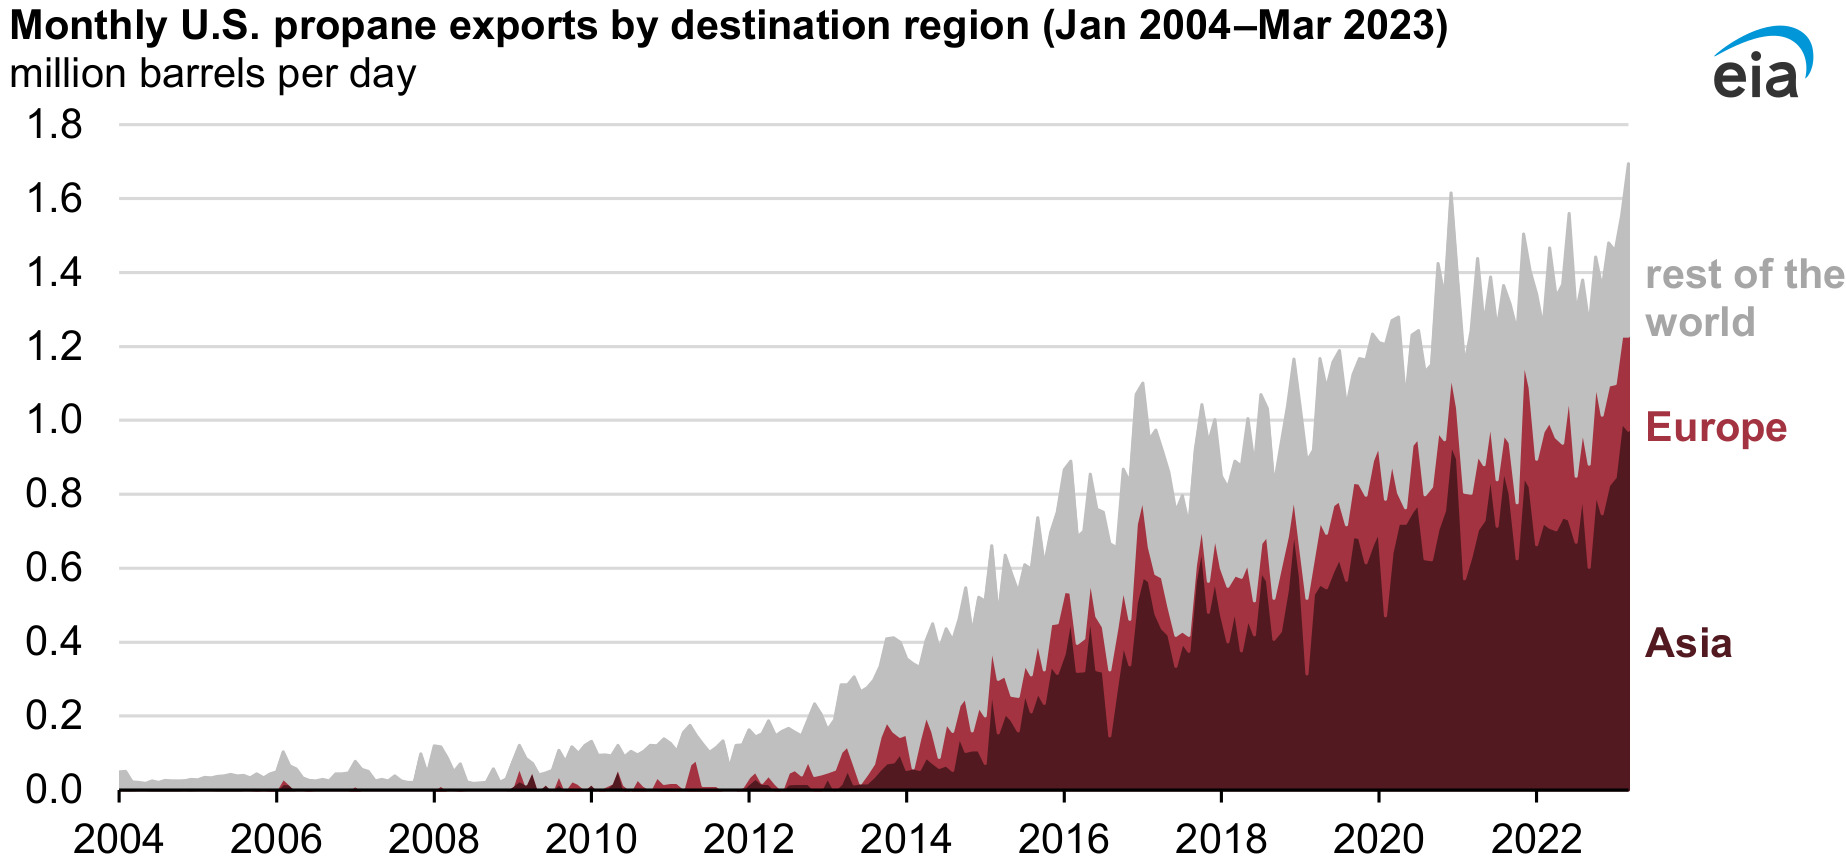
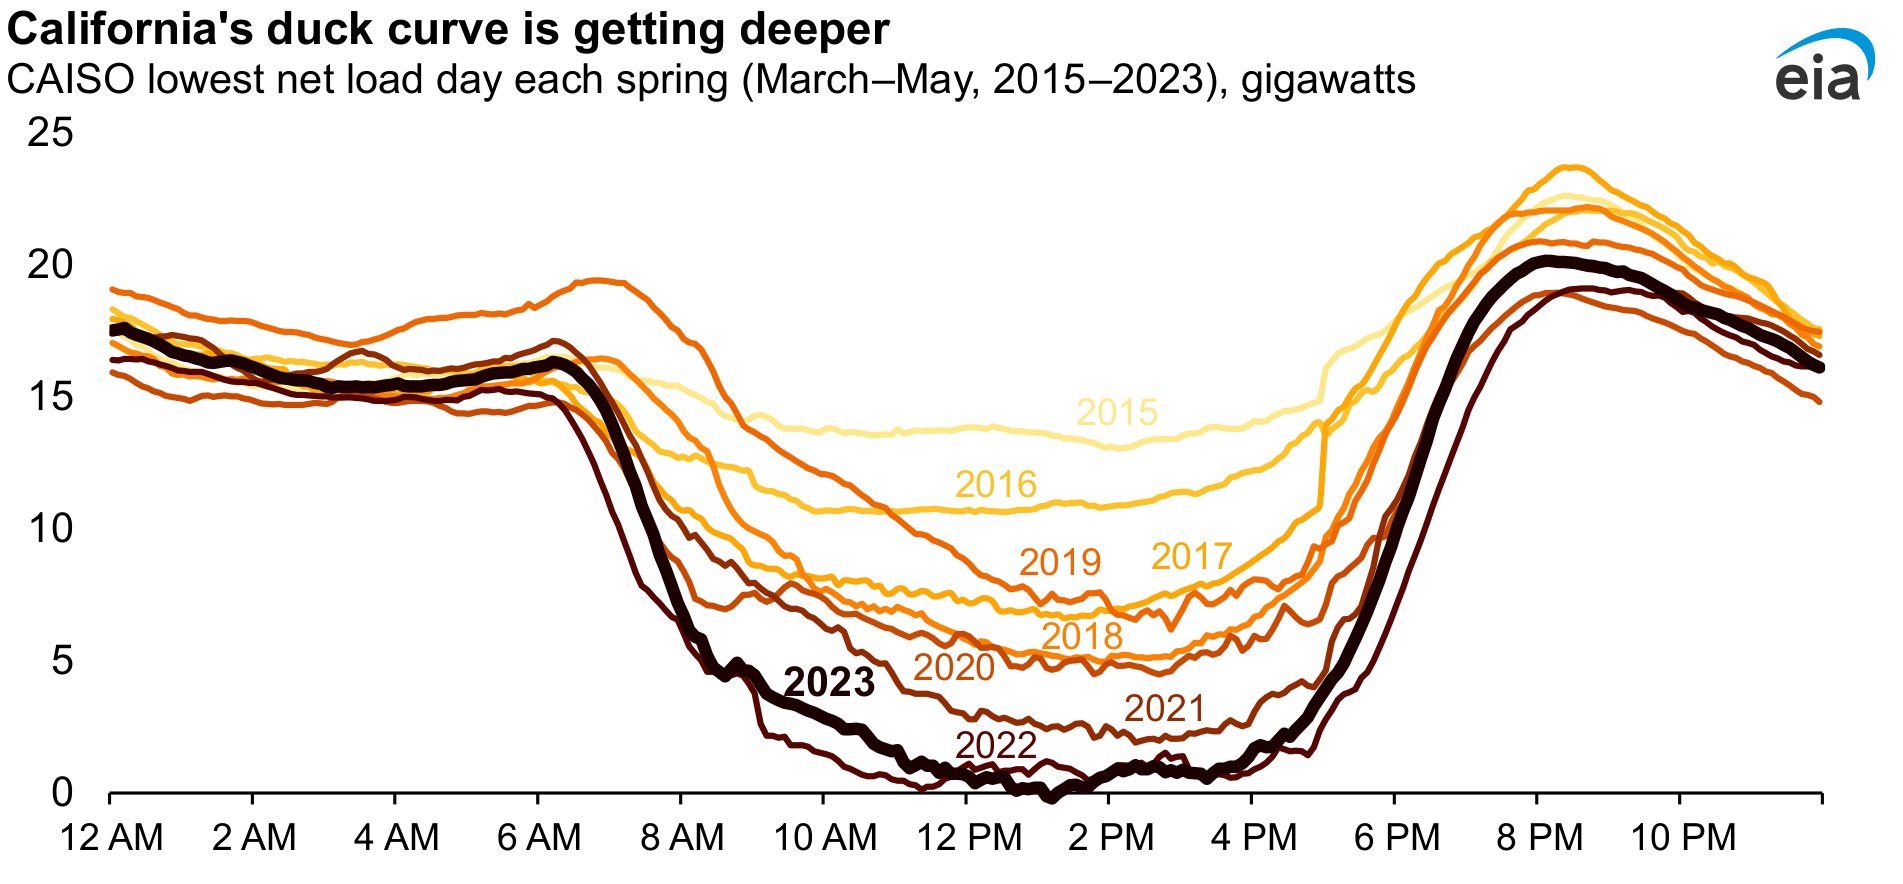
As more solar capacity has come online in California, grid operators at the California Independent System Operator (CAISO) have observed a drop in net load (or the demand remaining after subtracting variable renewable generation) in the middle of the day when solar generation tends to be highest. When graphed for a typical day, the pattern created by the midday dip in the net load curve, followed by a steep rise in the evenings when solar generation drops off, looks like the outline of a duck, so this pattern is often called a duck curve. As solar capacity in California continues to grow, the midday dip in net load is getting lower, presenting challenges for grid operators.
Two challenges with solar energy:
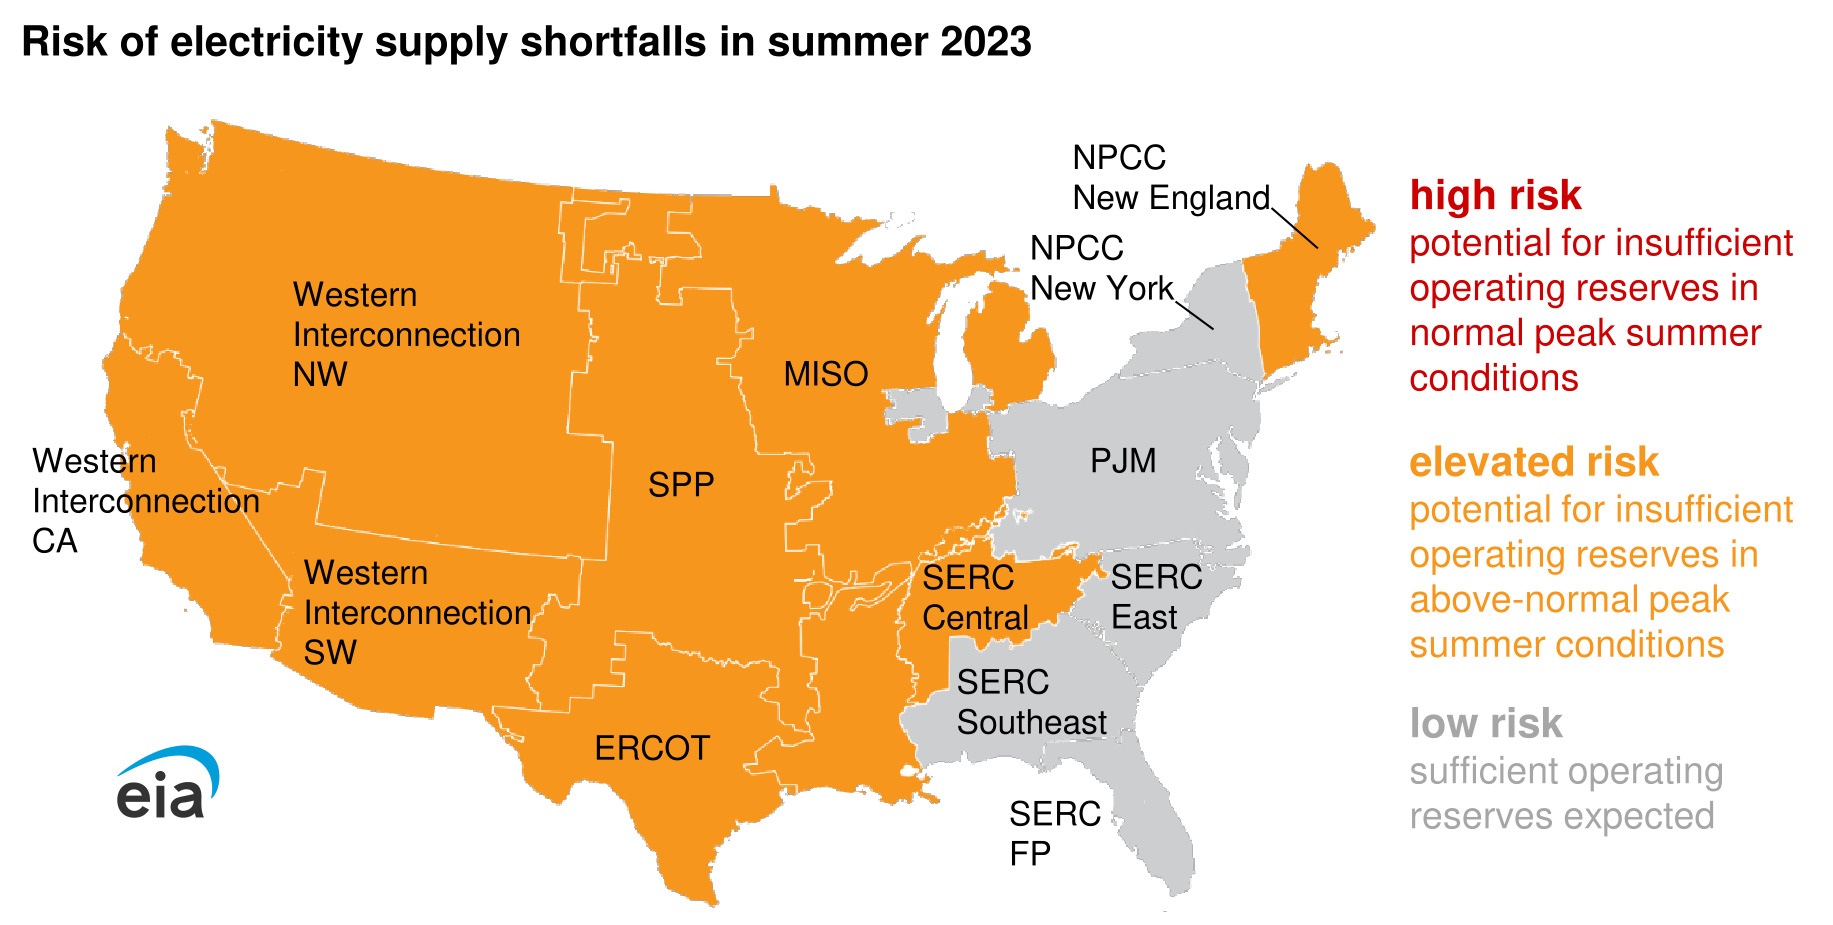
The first challenge is grid stress. The extreme swing in demand for electricity from conventional power plants from midday to late evenings, when energy demand is still high but solar generation has dropped off, means that conventional power plants (such as natural gas-fired plants) must quickly ramp up electricity production to meet consumer demand.
The other challenge is economic. The dynamics of the duck curve can challenge the traditional economics of dispatchable power plants because the factors contributing to the curve reduce the amount of time a conventional power plant operates, which results in reduced energy revenues. If the reduced revenues make the plants uneconomical to maintain, the plants may retire without a dispatchable replacement. Less dispatchable electricity makes it harder for grid managers to balance electricity supply and demand in a system with wide swings in net demand.
There are links to the data.
If you like data based articles check out my other side: Briefed by Data
 This post is really an ad for my new calculus textbook. I just received my author copies and thought I should promote it. For those that follow sustainabilitymath or use any of the calculus projects know that I’ve integrated many of them into the book. I also integrate R from the beginning so that students can tackle more real world problems and learn a little coding.