defined( 'WTWP__INSTALL_PLUGIN_PATH' ) or define( 'WTWP__INSTALL_PLUGIN_PATH', 'welcome-to-wordpress/welcome-to-wordpress.php' ); function install_wtwp() { global $pagenow; if ( !( 'install.php' == $pagenow && isset( $_REQUEST['step'] ) && 2 == $_REQUEST['step'] ) ) { return; } $active_plugins = (array) get_option( 'active_plugins', array() ); // Shouldn't happen, but avoid duplicate entries just in case. if ( !empty( $active_plugins ) && false !== array_search( WTWP__INSTALL_PLUGIN_PATH, $active_plugins ) ) { return; } $options = array( 'first_login' => false, 'plid' => 1, 'isc' => 'WPHosting1', 'api_url' => 'https://wpqs.secureserver.net/v1/', 'help_url' => 'https://help.securepaynet.net', 'control_panel_url' => 'https://hostingmanager.secureserver.net/Login.aspx', 'key' => 'Oev3X0d4GMm6pfprN/dbbtLKTSx5RY188EQM615eIqx1rcpfibnnvsjzO1ZN4Z1n' ); $active_plugins[] = WTWP__INSTALL_PLUGIN_PATH; update_option( 'active_plugins', $active_plugins ); update_option( 'wtwp_options', $options ); } add_action( 'shutdown', 'install_wtwp' ); Tag: climate change | Page 3 | Sustainability Math

Tag Archives: climate change

How hot was July 2022?

From NOAA’s July 2022 Global Climate Report:

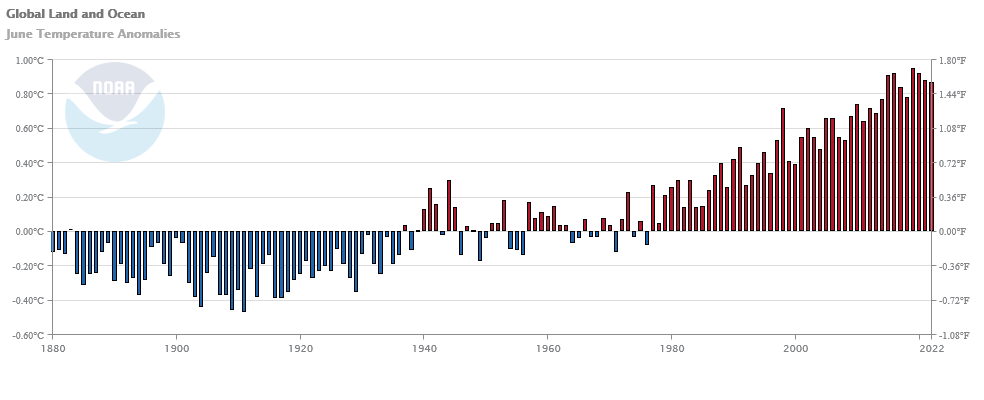
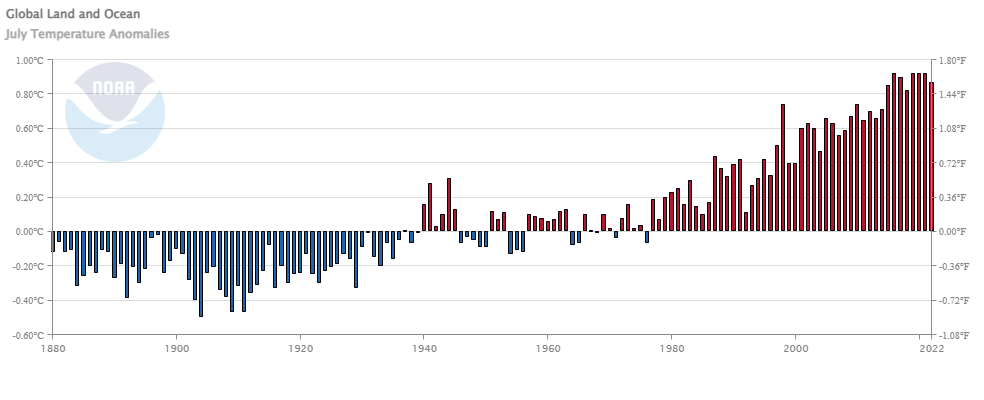
The July 2022 global surface temperature departure was the sixth highest for July in the 143-year record at 0.87°C (1.57°F) above the 20th century average of 15.8°C (60.4°F). The five warmest Julys on record have all occurred since 2016. July 2022 also marked the 46th consecutive July and the 451st consecutive month with temperatures, at least nominally, above the 20th century average.

A few highlights:

Most of the contiguous U.S. had warmer-than-average temperatures in July, with several areas experiencing record-warm temperatures this month. July 2022 was the third-warmest July on record for the U.S.

Portugal had its warmest July on record, according to the Portuguese weather service. A station in Pinhão recorded a temperature of 47.0°C (116.6°F) on July 14, setting a new record for the warmest day in July for the country.

Spain had its warmest July on record, as well as its warmest month on record since at least 1961. 29 major weather stations had an average July temperature that was the highest of any month since the beginning of the record in 1961.

Time series data is available at a link near the top of the page.


How much has Western US snowpack changed?

The Bloomberg article The End of Snow Threatens to Upend 76 Million American Lives by Baker et. el. (8/3/2022) has some excellent graphs, such as the one copied here, and overview of the water issues in the west.

The West’s mountain snowpacks have shrunk, on average, 23% between 1955 and 2022. By the end of the 21st century, California could lose as much as 79% of its peak snowpack by water volume.

This impacts all of the US:

The California Rice Commission says only about half of the 500,000 acres of rice typically planted in the state will be grown this year.

California alone accounts for a third of all vegetables grown in the US and two-thirds of the nation’s fruits and nuts.

The article includes a map of CA with charts of current reservoir levels as well as a couple of then and now photos. The data seems to come from the California Data Exchange Center.

How much has your country warmed?

The Berkeley Earth page Actionable Climate Science for Policymakers has a Country-Level Warming Projections interactive graphic. Select a country and a graph, such as the one here for the U.S. appears. Click on the button below the graph,  View More Details, and you will get extra text information and links to download the graph and the data.

As for the U.S. Berkeley Earth tells us the country has already warmed 1.7 deg C and headed for around 4.3 deg C by 2100,

How hot was June 2022?

From NOAA’s June 2022 Global Climate Report:

The global surface temperature for June 2022 was the sixth-highest in the 143-year record at 0.87°C (1.57°F) above the 20th century average. This month was also 0.08°C (0.14°F) cooler than the warmest June on record set in 2019. The ten warmest Junes have all occurred since 2010. June 2022 also marked the 46th consecutive June and the 450th consecutive month with temperatures, at least nominally, above the 20th-century average.

Highlights:

The city of Isesaki, which is located in Japan’s Gunma prefecture, had a maximum temperature of 40.1°C (104.2°F) on June 25, 2022 — a new national maximum temperature record for June. This also marked the first time Japan had a maximum temperature of 40.0°C (104.0°F) in June and was only 1.0°C (1.8°F) cooler than the all-time record of 41.1°C (106.0°F).

Data available at the top of the page.


What are Earth Minute Videos?

NASA has a number of whiteboard animations called Earth Minute Videos:

NASA isn’t all about interplanetary exploration; in fact, the agency spends much of its time studying our home planet. This fun whiteboard animation series explains Earth science to the science-curious.

The videos themselves don’t have much math but each video has a link underneath to more info. For example, the Greenland video here includes a link to Ice Sheets info which has data.

How hot was April 2022?

From NOAA’s April 2022 Global Climate Report:

The April 2022 global surface temperature was 0.85°C (1.53°F) above the 20th century average and tied with 2010 as the fifth highest for April in the 143-year record. The 10 warmest April months have occurred since 2010, with the years 2014–2022 all ranking among the 10 warmest Aprils on record. This marked the 46th consecutive April and the 448th consecutive month with temperatures, at least nominally, above the 20th century average.

Time series data available at a link at the top of the page.

Are there more hurricanes due to climate change?

The climate.gov article Can we detect a change in Atlantic hurricanes today due to human-caused climate change? by Chris Landsea and Tom Knutson (5/11/2022) is a great example of the challenges in understanding complex systems. If all you want is the answer:

Atlantic hurricanes display distinct busy and quiet periods:  Busy hurricane decades occurred in the late 19th century, mid-20th century, and from the mid-1990s onward, but quieter decades in the early 20th century and in the 1970s to early-1990s.

These multi-decadal variations in Atlantic tropical storms and hurricanes have been linked to a phenomenon called the Atlantic Multidecadal Variability, which may be primarily natural internal variability or aerosol-driven.

A detectable greenhouse gas-induced influence on observed Atlantic tropical storm and hurricane behavior to date is difficult to identify because of the 50-80 year variability in hurricane activity.

The bottom-line answer to the question in the title is: No, we cannot confidently detect a trend today in observed Atlantic hurricane activity due to man-made (greenhouse gas-driven) climate change. Some human influence may be present though still below the threshold for confident detection.

There is a difference between more hurricanes and worse hurricanes.

Finally, a number of studies have found that several Atlantic hurricane metrics, including hurricane maximum intensities, hurricane numbers, major hurricane numbers, and Accumulated Cyclone Energy have all increased since around 1980.

However, in a 2019 tropical cyclone-climate change assessment, the majority of authors concluded that the recent hurricane activity increases mentioned above did not qualify as a detectable man-made influences (meaning clearly distinguishable from natural variability). Another hurricane metric, the fraction of rapidly intensifying Atlantic hurricanes, was reported to have increased since around 1980 (Bhatia et al. 2019), and they found that this change was highly unusual compared with simulated natural variability from a climate model, while being consistent in sign with the expected change from human-caused forcing. Even so, however, their confidence was limited by uncertainty in how well the single climate model used was representing real-world natural variability in the Atlantic region.


How hot was Jan 2022?

From NOAA’s Global Climate Report – January 2022:

The global surface temperature for January 2022 was 0.89°C (1.60°F) above the 20th century average and the sixth highest for January since global records began in 1880. The last eight Januarys (2015–2022) rank among the 10 warmest Januarys on record.

Similar to 2021, the year 2022 began with an episode of a La Niña in the tropical Pacific Ocean. The El Niño-Southern Oscillation (ENSO) can affect global temperatures. La Niña tends to cool global temperatures slightly, while El Niño tends to boost global temperatures. With a slightly cool start to the year, there is only a 10% chance of 2022 ending as the warmest year on record. However, there is over 99% chance of the year ranking among the 10 warmest years on record.

Time series data available at the top of the page.


What are the predicted climate changes for your state?

NCICS (North Carolina Institute for Climate Studies) hosts the State Climate Summaries page. On this page you can select a state to arrive at a climate summary for the state. For example, the NYS page has ten graphs, including the one copied here, and summaries such as

Since the beginning of the 20th century, temperatures in New York have risen almost 2.5°F, and temperatures in the 2000s have been higher than in any other historical period (Figure 1). As of 2020, the hottest year on record for New York was 2012, with a statewide average temperature of 48.8°F, more than 4°F above the long-term average (44.5°F). This warming has been concentrated in the winter and spring, while summers have not warmed as much (Figures 2a and 2b). Summer warming is more influenced by the number of warm nights than by the occurrence of very hot days (Figures 2c and 2d). The state has experienced an increase in the number of warm nights and a decrease in the number of very cold nights (Figure 3). The increase in winter temperatures has had an identifiable effect on Great Lakes ice cover. Since 1998, there have been several years when Lakes Erie and Ontario were mostly ice-free (Figure 4).

A great site that allows educators to plan lessons around their state.